Introduction
Inflation as measured by the Consumer Price Index (CPI) for the Phoenix metro area rose 2.3% year-over-year in August, a decrease from 2.7% in June. This latest reading represents the 42nd consecutive month of inflation above the standard target of 2.0% annually. The rate of price increases continues to slow nationally (now +2.5% year-over-year).
Between June and August, the CPI for the Phoenix area decreased -0.3%, or an annualized rate of -2.0% (local inflation numbers are published every two months); the U.S. figure increased at 0.34% over the two-month span. National figures showed inflation continuing its slow decline from 3.0% year-over-year in June to 2.5% in August. July and August mark the first two months in years where the headline national inflation rate has fallen and remained below 3.0%. Persistent national inflation above 3.0% has delayed plans by the nation's central bank for interest rate cuts, but that time may be approaching, but today’s data likely ends those delays. At least one rate cut in September appears certain.
Shelter inflation increased 0.4% in the two-month period between June and August - an annualized rate of 2.5% (down from 3.9% in June). Year-over-year, shelter costs in the Phoenix MSA rose 3.8%. The price index for all items less shelter costs declined -0.8% since June. Excluding shelter costs, price increases in the greater Phoenix area now seem largely controlled.
Prices in Metro Phoenix decreased -0.3% (month-over-month) and increased +2.3% over the year (August ’23 through August ’24) - (BLS CPI Survey)
- Although the year-over-year inflation rate is above the 2.0% target, it has been slowing down. August is the 11th consecutive month of inflation below 3.0% and is currently the lowest year-over-year rate in Phoenix since February 2024.
- August ended the 4-month streak of year-over-year inflation rate increases; local prices increased +2.3% (down from 2.7% in June).
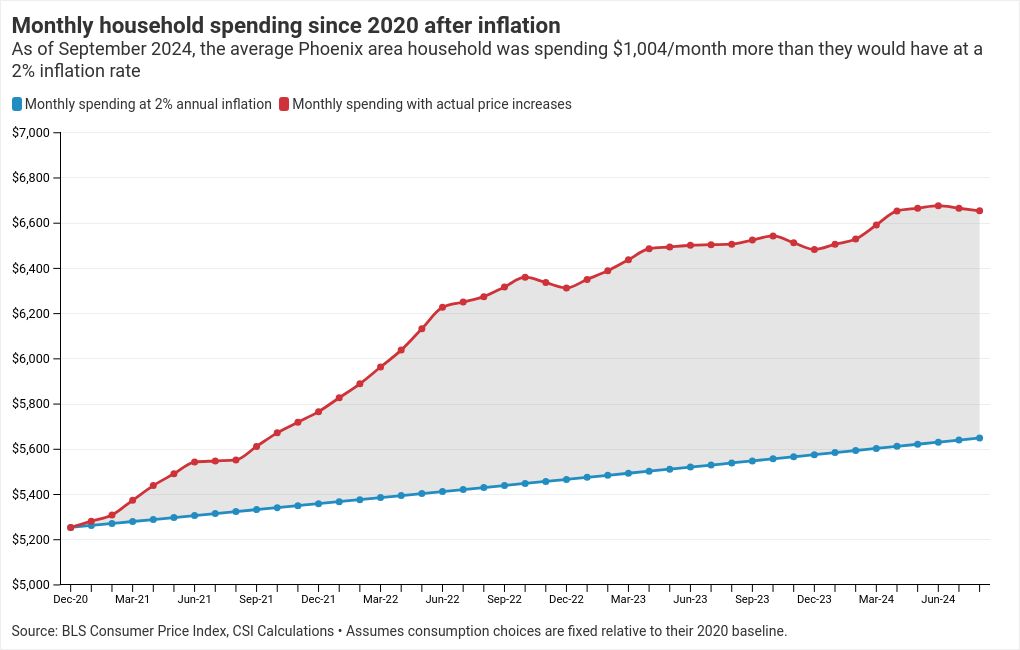
- Since the end of 2020, the typical Arizona household would have had to spend a cumulative $39,722 more on food, housing, transportation, and other goods and services to buy the same stuff as they were buying three years ago.
- Had inflation instead run at 2%/year over the past four years, it would cost the typical Arizona family over $9,930/year less to purchase the same goods and services today.
- Even if the rate of inflation slows, it would take a sustained period of deflation to restore historical price levels.
- Inflation in metro Phoenix over the past 12 months (2.3%) remained lower than the national average (2.5%).
- Of the 23 urban consumer price indices tracked by the BLS, the Phoenix metro area once again had the 5th lowest rate of measured inflation over the past year (backwards-looking) and month-over-month (real-time).
- Real incomes in Arizona are again falling; while inflation rose 2.3% incomes only rose 2.1% over the past year. Keeping in mind longer-term rising prices real wages in Arizona have fallen 7.4% since peaking in April 2020.