Introduction
Tucson, Arizona’s second-largest city and home to a population of approximately 546,574 Arizonans as of 2023, has experienced relatively tepid economic growth over the last decade.
[i] Despite its size and strategic location, Tucson's economy has struggled to keep pace with both statewide growth and national trends. While Arizona and other major areas within the state have experienced significant economic expansion in recent years, particularly in sectors like manufacturing, Tucson has lagged behind despite having a large manufacturing sector itself – hampered by poor governance, inefficient fiscal policies, and an over-reliance on government enterprises.
This report examines the root causes behind Tucson’s economic underperformance, the impact of fiscal mismanagement, and the consequences of policy decisions that continue to hinder growth, including policies and attitudes towards crime and homelessness. By exploring these key factors, we can better understand why Tucson has struggled to match the economic success seen elsewhere in Arizona – and what needs to change for the city to thrive.
Key Findings
- Over the last two decades economic growth in the Tucson region has lagged the rest of the state. According to real gross domestic product (RGDP) data, Arizona’s economy grew 30% between 2001 and 2023, while Tucson’s economy grew only 20%; the Phoenix MSA grew over 32%. Job growth was relatively stagnant as well; Tucson saw non-farm payroll grow only 2.6% over 2019 levels, while Arizona more broadly experienced over 3 times this growth.
- Tucson spends slightly more than Phoenix on a per-capita basis but invests significantly less in core functions like local police and fire. According to budget data for FY 2023 and the latest available census population estimates, Tucson’s city government spends $3,778 per resident – 4.3% more than the city of Phoenix – but allocates only $357 per resident to its local police – 31% less than the $515 per resident the city of Phoenix allocates to its police. The combined per-capita allocation to Tucson’s Police and Fire departments is only 11% higher than what the city of Phoenix allocates to its police alone.
- Despite record revenue growth, including an anticipated $356 million (54.4%) more in state shared revenues between 2023 and 2027 relative to the prior 5 years, Tucson voters are being asked to consider their 4th tax increase in 5 years. This tax increase, referred to as Proposition 414 the “Safe and Vibrant City” proposal, would increase the city TPT rate from 2.6% (50th highest out of all 91 cities and towns) to 3.1% (25th highest).
An Economy Lagging Behind
Despite boasting a large and recently growing manufacturing sector, overall economic growth in the Tucson area has for decades lagged behind the state as a whole, Tucson’s peer, the Phoenix MSA, and even the United States as a whole. Real per-capita Gross Domestic Product did not grow from 2001 through 2015; growth accelerated in the last decade but the region remains far behind its peers. Despite the Great Recession hitting Arizona in its entirety – especially the Phoenix metro area – thanks to the rapid expansion of the area’s construction and housing sectors during the ‘housing bubble’ – Arizona and Phoenix recovered swiftly. As of 2023, the Arizona economy was nearly 30% larger than it was in 2001, while Tucson’s economy was roughly 20% larger.
This relative economic malaise can also be seen in Tucson’s labor market and population growth. Except for the Great Recession period and despite a relatively strong manufacturing sector, job growth in Tucson lagged Arizona’s overall job growth numbers every single year since 2001. More recently, the hit to Tucson’s total non-farm employment during the 2020 recession was much more significant than either the Phoenix MSA or the state overall, and despite the loss of more jobs, Tucson’s recovery since has been tepid.[1] Following a similar pattern as GDP, the Tucson MSA had only 2.6% more jobs in 2023 relative to 2019, while the state of Arizona overall boasted 8.6% more.
Current demographics in the area point to this trend continuing in the future. According to the latest U.S. Census Bureau estimates, Tucson and the surrounding metro area is disproportionately older than Arizona, the entire U.S., and even the neighboring Phoenix metro.
Additionally, out of these four areas Tucson has the lowest share of its population between the prime working ages of 25-54. At 35.3% of the total population as of 2023, this age cohort in Tucson was nearly five full percentage points lower than the Phoenix metro and the U.S. Not only that, but this group in Tucson also demonstrated the second lowest labor force participation rate out of peer western MSAs.[ii]
Rather than an unfavorable snapshot from a specific year, these demographic issues may be more of a long-term trend. In the decade between 2013 and 2023, all four areas experienced a significant increase in the population aged 55 and above – unsurprising given broader demographic changes across the world – with Tucson and Arizona overall seeing a 4.8 percentage-point increase in this population, compared to 4.6 and 4.1 for Phoenix and the entire U.S.

However, Tucson’s prime working age population fell by 2 percentage points over this time, more than double the decline for the Phoenix metro (-0.9 percentage points) and nearly double the decline for Arizona overall (-1.2 percentage points). While the Tucson metro appears to be gaining in its share of Arizona’s younger population – thanks to the presence of the University of Arizona – this hasn’t translated into growth for the prime working age cohort, nor has it paid off in terms of stronger employment growth. Many of these young people ultimately leave the area when ready to enter the workforce.
Coupled with lower incomes on average in the area, these economic and demographic woes have led to declining income relative to the rest of the state. Though on average Tucsonans earned the same as Arizonans overall prior to the Great Recession, today they are 8% poorer than the average Arizonan.
Barriers to Future Economic Growth
The economic picture over the last decade raises a question; why has Tucson’s economy lagged the U.S. on average, despite residing in one of the fastest growing states? On paper, Tucson enjoys some advantages over the Phoenix metro. Housing costs are lower, and overall cost of living is cheaper. The city is home to a premier public University, major manufacturers, and a significant military presence. Data suggest, though, that it clearly struggles in one area central to economic growth: local government policy.
“Organized retail crime in Tucson is escalating into a significant concern, with thefts rapidly becoming more sophisticated and costly”
-Arizona Sonoran News, May 1, 2024
|
Crime and Homelessness
Arizona’s growth has come, in some degree, from attracting productive individuals and businesses from other parts of the nation, like California, that feature higher taxes and more burdensome regulatory structures. In 2023, Arizona ranked 5th in net domestic migration, with most of those new residents coming from California.[iii] Although Tucson has captured some of the migration coming into the state, a disproportionate number flowed into the neighboring Phoenix-Mesa-Scottsdale MSA, with those new residents exhibiting higher incomes on average compared to the new residents moving to the Tucson area.[iv]
Affordability is often the primary driver behind moving to a new city, and yet despite being much more affordable relative to the Phoenix MSA – especially for housing – Tucson has failed to capitalize as much as other areas on Arizona’s recent population boom.[v]
The exact cause of this is difficult to determine, but recent crime and homelessness trends likely contribute. According to the state point-in-time (PIT) counts – which are gathered at the county level – Pima County’s population-adjusted count of the unsheltered homeless surged 184% between 2020 and 2022, surpassing the rate for Maricopa County and remining higher as of the latest data. In contrast, Maricopa County saw a mere 29% increase.
Historically, Tucson has seen higher crime rates than the rest of the state as well. Making Action Possible (MAP) for Southern Arizona notes that in 2021 Tucson was home to the fifth-highest homicide rate among peer western MSAs with a rate of 6.7 murders per 100,000 residents. Tucson also featured higher rates of violent crime overall, higher firearm fatalities, and higher larceny/theft rates than the U.S. average and the neighboring Phoenix MSA.
[vi][vii]
Rising crime and homelessness are not unique to Tucson and Pima County more broadly, but the area’s more acute problem with these phenomena coincides with self-described progressive policies and attitudes reflected by local governments and the police.[viii] Leniency towards public camping, vagrancy, drug use, and other minor offenses, including by:
- Requiring police officers to refer suspects with drugs in their system to local hospitals in lieu of arrest[ix]
- Shifting attention to lowering the incarcerated population through early-release and other policies[x][xi]
- Allowing the population-adjusted city police force to decline in size, all create an environment where offenders face reduced incentives to follow the law.
As CSI Arizona highlighted in its recently published cost of crime report, policies excessively lenient towards crime often breed more of it – a reality that Tucson and Pima county are likely experiencing to some degree. For example, the number of drug prosecutions fell drastically between 2019 and 2021, precisely the time that homelessness, drugs, and violent crime in particular were all surging. The number of dismissed and declined cases as a share of all prosecutions rose during this time as well.
Beyond policies and attitudes towards crime, Tucson has historically employed less police per-capita relative to the rest of the state, despite – as mentioned above – having higher crime rates on average. As of 2023, FBI data shows that Tucson had 2 police officers for every 1,000 residents, compared to 3 officers per 1,000 for the state overall.[xii]
This level of crime and homelessness is having a marked impact on local businesses. Where businesses would once lose around $350,000 per year from loss and theft, local police say that some are now losing up to $1 million or more.[xiii] Rising petty crime and vandalism, along with the explosion in open drug use and homelessness are imposing costs on businesses both through theft and damage, but also through lost customers and the need to increase security measures, which in turn is depressing economic growth.[xiv][xv]
Government Spending Priorities
In the more than two decades between 2002 and 2023, overall city expenditures for Tucson rose 129% (over 4% per year on average). During that same time spending on Tucson’s police grew only 80%, or less than 3% per year. By 2023, Tucson police captured only 9.4% of all city spending, down from 15% in 2011. In contrast, the city of Phoenix spends over 26% of its total budget on policing. More recently though, spending in Tucson has surged, growing on average nearly 8% per year since 2023 – easily surpassing the common benchmark of combined population and inflation growth.
Per-capita expenditures can serve as a useful tool to evaluate how efficient a region’s government is with its available resources, as presumably the public goods provided by that government are dependent on the local population size. Using the latest Census population estimates, Tucson’s city government spent $3,778 per resident in 2023, with only $357 of that going to local police. In contrast, the city of Phoenix spent $3,623 per resident in total – 4.1% less than Tucson – but sent $515 per resident to local police. The combined funding for both police and fire in Tucson was just slightly above the per-capita funding that Phoenix allocates to its police department alone.
Additionally, Tucson has consistently spent around 20% of its city budget on transportation, including capital projects, new roads, repairs, public transit, and other infrastructure, but the city has had relatively little to show for it. Tucson has been historically plagued by lack of highways and inefficient roads and has ranked poorly in pavement quality[xvi][xvii] and safety[xviii]. Instead, the city appears to have prioritized alternative transportation infrastructure – like bike lanes or free bus fare – while neglecting the core infrastructure that should precede these relative luxuries.[xix][xx]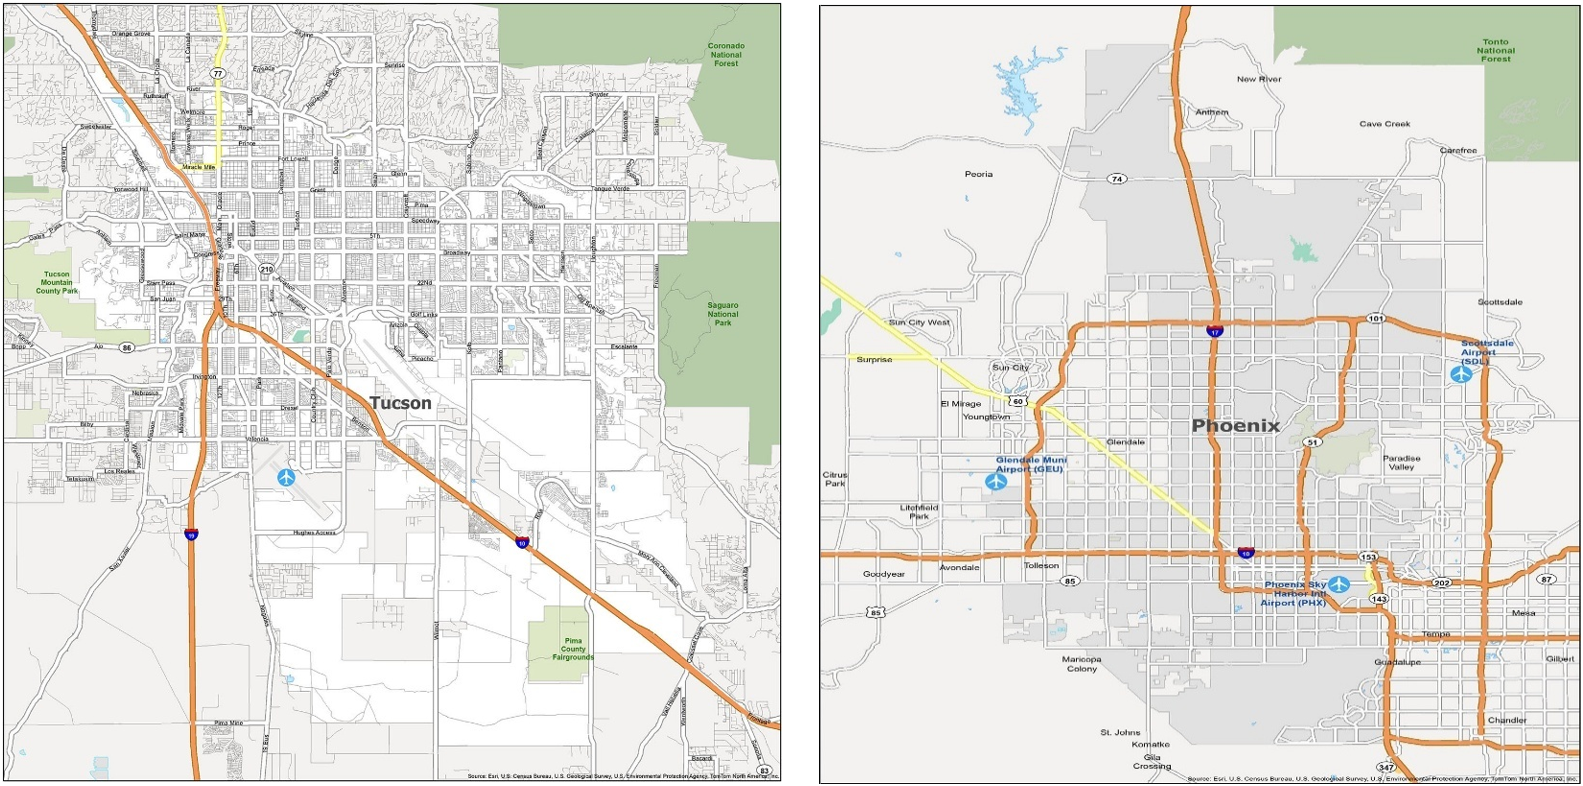
Figure 11 – While the Phoenix metro is crisscrossed by at least 8 major freeways, Tucson has only 1-2.
|
In contrast, the broader Phoenix metro area has seen significant expansion in its highways in the last decade, allowing for economic expansion to spread further into the western parts of the valley. These projects include the expansion of the Loop 303 highway, creation of a new Northern Parkway highway to connect the west valley to the 101 highway, and the expansion of the Loop 202 highway.
[xxi] This growing transportation infrastructure has made the level of economic expansion experienced in the Maricopa County region over the last decade possible, and a lack of similar expansion within the Tucson area is likely playing a role in its relative economic performance.
Burdensome Taxes
With a combined average primary and secondary property tax rate of 13.54%, Pima county – home to the City of Tucson – ranks first (worst) among all 15 Arizona counties in the total property tax burden faced by its residents. This higher property tax makes ownership of real and personal property more costly, which in turn stifles investment and economic growth. Higher property taxes also raise the cost of housing, which, as discussed above, plays an important role in attracting both people and businesses to an area.
For example, according to the latest Abstract of the Assessment Roll published by the Arizona Department of Revenue, the average net assessed value for a Class 3 primary residential property in Pima county was $22,452, over 12% less than the $25,617 average for Class 3 properties in Maricopa County.[xxii] However, because of the higher tax rate, the average Class 3 property owner in Pima county pays $317 (11.6%) more per year than the average property owner in Maricopa county. If we then compare these property tax costs to average yearly mortgage costs for each area provided by Zillow,[xxiii] the property tax bill for homeowners in Tucson increases the costs of home ownership by around 14%, whereas the increase in Phoenix is less than 10%.[2]

Although property taxes are high within Tucson and the broader Pima county, the current TPT rate in the city is less than both the average and median rate among all 91 cities and towns in Arizona that have a local TPT rate. However, the city has seen its TPT rate increased three times since 2017, from 2.0% in June of 2017 to 2.6% as of 2018, including an extension of a 0.5% TPT increase that was originally intended to last only five years. All in all, Tucson has
already enacted more than $1.3 billion in additional expenditures through a combination of increased taxes and debt issuance since 2012.
[xxiv]
In 2017, Tucson voters approved Proposition 101, which “temporarily” raised TPT rates from 2.0% to 2.5%. The Proposition was estimated to bring in $250 million over five years, with $150 million going to vehicles, equipment, and facilities for the Tucson Fire and Police departments, and the remaining $100 million to road improvements. Actual collections over its five-year life were $312.5 million – or roughly 25% more than originally contemplated.[xxv] According to the City, only $161.2 million (52%) of those revenues have been spent.
Later in 2022, the local government in Tucson proposed – and voters approved – an extension of the Prop 101 0.5% sales tax increase for an additional 10 years. Of the $740 million in anticipated revenues over the 10-year period, 100% were intended to be spent on street improvements and upgrades.[xxvi]
In March of 2025 Tucson voters will be presented with yet another 0.5% tax increase via Proposition 414, the “Safe and Vibrant City” proposal, which proponents estimate will raise roughly $80 million per year over its 10-year lifespan. Like past increases, the tax increase is being sold as a way to boost funding for popular services like public safety and transportation, while also expanding funding for social programs like affordable housing, workforce development, youth programs, and others.[xxvii]
If Proposition 414 were to pass in March, Tucson’s overall TPT rate would climb to 3.1%, raising its ranking among all 91 cities and towns from 50th highest TPT tax to 25th highest. The combined TPT tax burden faced by Tucson residents including county and state TPT rates would reach 9.2%. Tucson – already struggling to attract growth and development – would become a relatively high-tax city in terms of its sales taxes, alongside already overly high property and other taxes and fees.
While we have acknowledged the issues concerning public safety and infrastructure in Tucson – particularly with the city’s roads and transportation network – the city continues to mask questionable management of resources with additional tax increases. For example, if spending on the city’s police had instead remained at 2011 levels – or 14.9% of all expenditures and still well below other cities like Phoenix – Tucson’s annual budget for its police force in 2025 would be nearly $73 million (25.7%) larger than it is today, and would have had hundreds of millions in additional funding over the last decade and a half, eliminating the rationale for these recent tax increases.
Furthermore, the chief argument in favor of the tax increase centers around the city’s falling distributions from Urban Revenue Sharing (URS). The URS program shares state personal and income tax receipts with cities and towns at a rate of 18% of the receipts from two years prior. This rate was increased from 15% beginning in FY 2024 as part of a larger state tax reform that ushered in a 2.5% flat personal income tax rate. The increase in URS was an explicit attempt to hold harmless Arizona cities and towns from the reduction in income tax revenues coincident with the implementation of the flat tax.
While it’s true that URS distributions will fall around 19.5% in FY 2025, this decline is measured from a one-time peak created in 2024 through both a short-term surge in state-wide revenues and an intended increase in the URS distribution rate to cities and towns to protect against future revenue declines. The irony of Tucson using a partially state-engineered windfall to attack the flat tax and invent shared revenue cuts is not lost on this organization.
Adding state-wide changes to the tax code, including the legalization and inclusion of adult use marijuana into the tax base, and the remote seller/marketplace facilitator expansion resulting from the Supreme Court decision in South Dakota v. Wayfair, cities like Tucson have received even more in revenues than they expected just a few years ago (again, note the 25% over-performance of Prop 101 relative to projections).
For example, URS distributions to Tucson in 2025 will be over 63% larger than they were just three years ago, equating to an 18% annual growth rate each year between 2022 and 2025. In its fiscal 2023 budget the city of Tucson contemplated a 14.8% increase in the state shared TPT revenues over 2021 levels.[xxviii] But according to revenue distributions published by the Arizona Department of Revenue, the shared TPT revenues to the city actually increased 24%.[xxix]
All together, total shared URS and TPT revenues for the city of Tucson are projected to reach over $200 million in 2027, down slightly from the $227 million received from these sources in 2024, but 41.7% larger than if revenues had followed the 2013-2020 trend, and even 28% larger had they instead grown at the same pace of inflation and population growth since 2013. In total, over the five years following the implementation of the 2.5% flat tax in 2023, the State of Arizona is projected to share $226.1 million (64.4%) more income tax revenue, and $356 million (54.4%) revenue overall with the City of Tucson than it shared over the five years prior.
Unlocking Future Growth
Despite the problems facing the region, Tucson has great potential for economic growth. The presence of both the University of Arizona and Davis-Monthan Air Force base and the city’s proximity to the southern border all provide a strong baseline of economic potential that, if unleashed through productive responsible governance, could propel the city up the economic ladder. Based on the problems identified in this report, there are three things that would help to boost the economy of Tucson.
Removing Barriers to the Free Enterprise System
Tucson should look to find ways to reduce costs for local residents and businesses, which will make the city more attractive relative to the rest of the state and in turn attract. As discussed previously, the broader Pima county has the highest property tax rate and reducing it could have significant impacts on both the cost to own a home and a business. The same goes for local TPT rates. Lessening the economic burden associated with both ensures residents have more money to spend on the local economy.
Refocusing Local Government
Policing and ensuring the safety of the public is a function reserved solely for government, and the responsibility to address the current crime and homelessness issues in Tucson rests with the city government specifically. However, declining investments in city police relative to all spending and a growing focus on progressive policing and criminal justice policies have led to a deterioration of public safety in Tucson – a problem that can be turned around by refocusing expenditures towards the things that matter and a reevaluation of progressive criminal justice policies.
To illustrate this point, the city could have allocated $73 million more in funding to local police in 2025 alone if they had instead kept funding at a constant 14%-15% of total expenditures – on par with 2011 levels and allowing for more police officers and technology to combat crime. Recognizing the need to address crime and public safety, city officials are instead proposing a tax increase through Proposition 414, which will allocate around $28 million a year to police and fire for the next 10 years. In this example, a refocusing of government priorities using the current level of resources would allocate 160% more funding for local police and fire than the imposition of yet another tax increase.
Leveraging Tucson’s Unique Features
The University of Arizona (UA) and Davis-Monthan Air Force Base are some of the more valuable features that the city has to offer, and both would likely magnify any economic growth resulting from the first two solutions presented above. Both provide the city with a well-paid populus that is relatively insulted from the ups and downs of the local economy due to state and federal funding, and in turn provide a stable source of demand for the local economy.
The University produces a “home-grown” skilled workforce, but currently only a fraction stays in the region to work after graduating, in part due to the lack of job opportunities in the area.[xxx] [xxxi] By getting crime under control and refocusing local government on key issues hampering economic growth, the city will become more attractive for business, especially given the local pipeline of young, educated workers. As businesses grow, so will employment and income, encouraging further economic growth.
Bottom Line
Tucson has not been growing, and due to demographic change and its failure to attract or retain young people and migrants, its prospects going forward look increasingly dim. The region on the surface enjoys many of the same advantages as Arizona’s other major metro area – the Phoenix region – but it struggles under the yolk of too much government spending, a burdensome regulatory environment, high taxes, and a lack of focus on the core functions of government (roads, public safety, and infrastructure). However, addressing these issues has the potential to induce economic growth largely unseen in Arizona’s second largest city.
[1] All else equal, areas that are hit harder during recessions tend to see stronger growth following those recessions.
[2] Calculated using average mortgage payment for each region assuming a 20% down payment according to Zillow. Annual mortgage costs calculated by multiplying the latest monthly average (December 2024) by 12.