Introduction
Since universal eligibility in 2022, Arizona’s Empowerment Scholarship Account (ESA) program has seen rapid growth. A lack of reliable and consistent data about who is using the program and how is contributing to the public uncertainty. The relatively inconsistent reporting by official sources, like the program’s administrators and marketplace vendor, has enabled misinformation and exaggeration to thrive.
Subject to the available data, this regular report is intended to provide ongoing and consistent answers to some recurring questions that policymakers and the public have been asking, like:
- How many people are using the ESA program, how much bigger will it grow?
- What is that going to cost?
- What do these new ESA users look like, in terms of their demographic characteristics?
- And is the program being well-run and managed in the public interest?
The inaugural Quarterly ESA Update report provides our initial answers to these questions, based on the most-recently available data from the Arizona Department of Education (ADE), and our own estimates. Going forward, the Common Sense Institute will regularly update these answers and track their changes over time.
Key Findings
CSI expects the ESA program to grow to 89,500 students (+5.2% from January 23,2025 enrollment) by the end of FY 2025 (June 30th). Depending on how many students are using an STO, this is at or near the program’s natural growth limit; future enrollment growth will increasingly depend on families switching to from other options.
- The cost of the ESA program is estimated to reach $861.2M this year. For context, total public funding for K-12 in Arizona will be over $10 billion this year; ESA spending will be less than 8% of total K-12 funding.
- A likely majority of ESA users continue to come from middle-income households (defined as those earning between $75,000 and $150,000 per year). 56% of ESA students live in ZIP codes where the median income of families with at least one child is between $75k and $150k; 35% of all Arizona families earn between $75k and $150k. While their expected income has drifted higher in the latest data, a disproportionate share of middle-income households use an ESA.
- CSI estimates that over 18% of ESA users are nonwhite, and that nearly 13% live in rural areas while 21% of Arizonans are nonwhite and 11% live in rural areas.
- For the entire period that data is available, CSI estimates that the ESA program has consistently approved far fewer expenditures than there is available funding. This implies a substantial and growing backlog of pending purchases, and growing ESA fund balances. In Q3 2024, ADE approved expenditures for only 71.8% of expected available ESA dollars.
- Efficient program governance has not been a priority. This has led to a growing backlog of unapproved purchase and reimbursement requests, and lengthy program processing delays.
How Much Larger Will The Program Grow?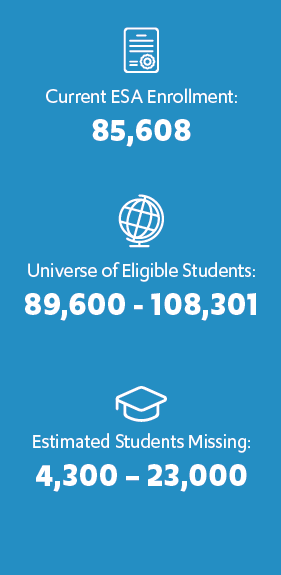
As of January 27, 2025, 85,198 students were enrolled in Arizona’s ESA program; given our best estimates of Arizona’s total school-aged population and enrollment in other programs, there are a total of 108,301 students eligible for an ESA or STO in Arizona today. Give uncertainty about how many students are using an STO scholarship, the number of students in Arizona today not already on an ESA who could enroll is between 4,300 and 23,000. Further growth after that would have to come from students leaving other publicly-funded options.
Arizona today effectively provides K-12 formula funding on a fully per-student basis; any 5-17 year old Arizona resident is guaranteed at least one publicly-funded option to offset the costs of their K-12 education, regardless of where they attend. Of these options (public district, public charter, private school with an STO scholarship, or home- and private-school with an Empowerment Scholarship Account) there is a universe of students choosing each one.
According to the 2023 American Community Survey, there were 1,188,937 5-17 year old children in Arizona; CSI estimates that number declined to 1,187,874 by the end of 2024. Of those, an estimated 108,301 school-aged children in Arizona do not attend District or Charter public schools. These students likely attend a private- or micro-school or are homeschooled and are probably eligible for an Empowerment Scholarship Account. However, some number of these are probably already receiving a School Tuition Organization (STO) scholarship award, which is Arizona income tax-credit funded. On the other hand, there may be some students attending Arizona public schools part-time who are tuition-paying and potentially ESA-eligible.
In FY 2023, STO’s gave 75,817 scholarships to students attending private schools. The average scholarship is estimated to be $2,692.[i] Because students can receive multiple scholarships and STO’s are not required to report recipient student counts (only the number of scholarships), CSI estimates that participating students receive an average of 3.98 scholarships. Given this assumption, 18,700 students are receiving an STO scholarships and ESA ineligible. This leaves a low estimate of 4,300 students remaining outside of publicly funded education in Arizona. The high end of this estimate, 23,000 students, assumes all students not in a public school are either in the ESA program or going unfunded (effectively assuming no STO offset). Given the uncertainty surrounding STO utilization, the actual number of students eligible for but not already enrolled in the ESA program is likely somewhere in the middle.
In summary, CSI estimates that there were 108,301 school-aged children in Arizona who were not attending a public school full-time, and therefore eligible for an ESA. Of those, 85,198 were enrolled in the ESA program (as of January 27th, 2025). After accounting for uncertain STO utilization, this leaves between 4,300 and 23,000 school-aged children eligible for an Arizona ESA but not already enrolled.
During the catch-up period when the ESA program was expanded to universal eligibility, enrollment grew from 12,127 students in June 2023 to 75,500 students by February 2024. Enrollment growth has now slowed; future enrollment in the ESA program will be a function of demographics and choice.
Going forward, ESA growth will increasingly come from other publicly funded options, in an often net-savings or cost-neutral fashion. For example, from FY 2019 to FY 2022 STO scholarships were steady at between 90,000 to 98,000. In FY 2023, issued scholarships fell to 75,800 (potentially generating an estimated $49 million in additional annual income tax payments). Many of these students likely switched to the ESA program. The portion of the STO students that decreased the least from FY 22 to FY 23 were the Low-Income and Disabled Corporate STO’s, suggesting that these students are receiving more in STO scholarships than they would with an ESA (potentially enough to cover a full private-school tuition); students receiving less in STO awards than they could from an ESA have likely already switched.
This trend is confirmed in the increasing share of students newly enrolling in the ESA program who previously attended public school. Intuitively, we would expect this ratio to rise over time as the number of students otherwise available to enroll goes down. According to ADE, in late-2022, over 75% of newly enrolled ESA students had no record of prior public school attendance[ii]; today that share is less than half.[iii]
How Much will the esa program cost this year?
The FY 2025 enacted budget appropriated[1] $9.93 billion for K-12 “Basic State Aid” formula funding.[iv] This funding is allocated to all District and Charter schools and ESA students based on a per-pupil formula and makes up about two-thirds of all state and local public education funding in Arizona.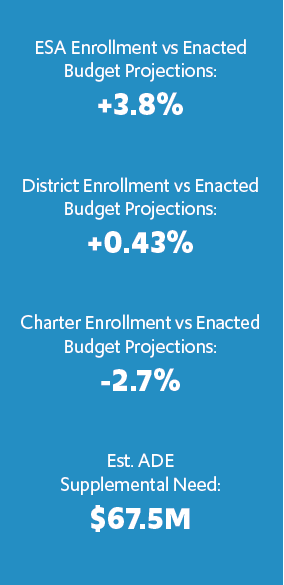
The FY25 Basic State Aid appropriation was expected to fund 82,400 ESA enrolled students, 852,000 District enrolled students, and 229,900 Charter enrolled students. These enrollment estimates were produced in August 2024. In recent years, enrollment has been particularly difficult to predict due to changes in educational preferences and demographic declines leading to falling enrollments – particularly in District public schools.
As of January 2025, CSI estimates actual Base State Aid formula costs will be approximately $67.5 million above the appropriation.
Empowerment Scholarship Accounts. $822 million was appropriated for an estimated 82,400 ESA students specifically. Actual enrollment as of January 27, 2025 is 85,198 students, and in the 2024 Quarter 4 Annual Report the average ESA award amount was $9,896. Based on these figures, CSI estimates the actual cost in FY 2025 to the general fund of the ESA program is $861 million.
At the end of this fiscal year (on June 30th, 2025), CSI expects ESA enrollment to increase by another 2,000 to 4,000 students. Historically, ESA enrollment has grown the fastest around September and then again at the beginning of the calendar year. Program enrollment typically declines during the summer months.
From the period of January 8, 2024 to the FY 2024 peak enrollment on April 8, 2024, ESA enrollment grew 5.23%. 5.23% more growth over the remainer of this fiscal year would see the ESA program enroll 89,500 students by the end of FY 2025.
The total expected need for the ESA program this year above its appropriation is $39.2 million. The FY2025 adopted budget estimated the program would reach 89,700 students in FY 2026. This is consistent with our estimated ESA universe of between 89,900 and 108,300 students.
District Public Schools. Approximately $7.0 billion was appropriated for an estimated 852,000 District students specifically. This was the lowest projected District enrollment figure in at least the last 20 years. According to the most recent estimates available to CSI (JLBC FY26 Baseline Book)[v], actual enrollment in traditional District public schools for the 2024-25 school year is 855,900 students – or about the same number of students as were enrolled in FY2003.
District public schools are awarded formula funding based on “100 day counts”, which should have been tabulated in October. However, there is both a significant lag and revision to these figures which can affect these estimates over a fiscal year.
This creates an expected General Fund cost of $30.7 million by the end of FY 2025, above the appropriation amount.
Charter Public Schools. Arizona also budgeted $2.11 billion for the charter schools basic state aid formula to support 229,900 charter school students. Estimated actual enrollment (according to the FY 2026 Baseline Book) was 223,700 students, at an estimated cost of $2.10 billion and creating $2.4 million in savings relative to the amount appropriated this year.
Overall, the total cost of Basic State Aid to District, Charter, and ESA students is likely to reach $9.98 billion leading to an expected deficit of $67.5 million in the appropriations for Basic State Aid in FY 2025. Of that amount, $861 million is attributable to the ESA program ($39M more than budgeted).
Who’s Using an ESA?
As of January 2025, 56.7% of all ESA recipients were living in Arizona ZIP codes with a median family income of between $75,000 and $150,000. This is up from 53.7% in April 2024. For context, 49.0% of all households with children under 18 reside in these ZIP codes; on the other hand, 35.8% of all Arizona families have household incomes between $75,000 and $150,000.
Because information about ESA recipients is released only in summary form by the Department of Education, analysts from the beginning of the program have been limited in their ability to draw broad demographic conclusions about participants. The Department does not collect or report information about family income, race, or other characteristics; it does collect and report ZIP-code level geographic data, however.
The American Community Survey does report information about the incomes and demographics of Arizonans by ZIP code. However, the sample - especially the 1-year – is relatively small. The low response counts in some individual ZIP codes introduces significant risk of survey error; on the other hand, statewide averages – and in particular statewide averages from the 5-year surveys – produce much more reliable estimates about the true population’s characteristics.
This is especially true when trying to draw conclusions about
households with school-aged children. In general, these households are concentrated in certain parts of the state, and those households (and ZIP codes) differ systematically from those without children. In general
, families and
households with children are
higher income than households without, and most children in Arizona are found in wealthier ZIP codes.
CSI uses the best data available to us to try and draw the most likely conclusions, given these limitations and uncertainties. For ESA users, that is ZIP code data, but for Arizona families in general, that is ACS 5-year statewide averages. However, for transparency, we also now report the share of all Arizona households with school-aged children residing in ZIP codes by median income, using the latest ACS 5-year estimates; while an “apples-to-apples” comparison with our ESA methodology, we repeat our caution regarding the uncertainty and small sample size.
There is also the question of whether to use “arithmetic mean” (average) or “median” sample values to estimate the characteristics of our population of interest (ESA recipients). In general, given large samples and repeated observation, the mean gives a “better” answer in terms of approximating the correct answer on average. In this case, though, we are dealing with often very small sample sizes subject to high skew. Imagine a ZIP code with fifty or fewer households with children (75 such areas in Arizona in 2023, according to the ACS), and a high skew (large difference between the mean and median reported household incomes). There may only be one or two ESA recipients in the entire ZIP code. In that case, what is more likely to estimate the true expected income of the local ESA recipient – the arithmetic mean, or the median? For example, there are only 154 households with children in ZIP code 85264. The mean family income is over $90,000 (related households, potentially without children); the median income for households with children is $53,800 (implying very high skew here). According to ADE, 7 families in this ZIP receive an ESA; should we estimate their income at $90,000, or $53,800? The choice matters greatly, but given the numbers, it is probably better to use the ACS-reported median income for households with children as our “best guess” of the (unknown) expected income of these ESA recipients.
CSI also notes how small the number of households involved are (and this occurs often in ZIP code-level data); any reporting of this data by ZIP that tries to “normalize” (for example, reporting x per thousand kids) conceals this scarcity issue and implies something that isn’t true (namely that there are potentially large numbers of ESA users or children in, say, Paradise Valley – a very high income ZIP code but with only 678 ESA users and 2,700 kids total).
In general, given this uncertainty, we rely on median values for ACS 1-year and ZIP-code based analyses (which are subject to our largest possible sample skew and survey error), but also calculate and report arithmetic means when feasible and defensible (where robust sample sizes minimize potential error and skew and allow the theoretical advantage of the mean to come through).
ESA users continue to lean disproportionately middle-income (defined here to be households earning between $75,000-$150,000). While a quarter of ESA users may live in households earning less than $75,000 per year, up to 40% of all households with children earn this much. On the other hand, while we estimate less than 3% of ESA-using households earn over $200,000 per year, up to over 13% of all Arizona families earn this much.
CSI has begun reporting other expected demographic characteristics of the ESA population here, using similar methodology as our approach to estimating incomes. This data relies on the same ZIP-code based methodology as our income estimates and is subject to the same measurement uncertainty. Again in general, what is striking is how similar ESA users to the overall population. We note three areas of marked difference (and will update these figures quarterly as data allows):
- While over 18% of ESA users are estimated to be nonwhite, this is statistically less than for Arizona’s overall population (21.3%).
- Over 12% of ESA users reside in rural ZIP Codes – statistically higher than the 10.7% of Arizonans overall.
- ESA recipients are statistically much more likely to come from married-couple households (52.5%, versus 47.0% of Arizona households overall).
Measuring Program Efficiency
As of February 6th, 2025, the most recent Quarterly Report released by the Department of Education applies to ESA activity occurring between April and June 2024 (FY24Q4). During FY24Q4, the Department of Education did not report how long it took to approve reimbursement requests; it took 13 days to approve a reimbursement request in Quarter 3. Marketplace transactions were approved at only 72% of their expected rate during FY24Q4; they were approved at 89% of their expected rate in FY24Q3.
The Department reports the annualized award amounts quarterly, and beginning last year is required by law to report total approved purchases. Assuming ESA users were on average exhausting their scholarships, and the Department were timely approving all expenditure requests, on average and over time approved expenditures would average out to 100% of annual scholarship awards. Given the Department does not report regular or consistent data about the pace of marketplace expenditure approvals (at all) or reimbursements, CSI uses this measure as a proxy to estimate how efficiently the Department is processing ESA transactions.

For the five quarters that data is available, ADE has never achieved a 100% of theoretical maximum expense approval rate. Approval rates peaked at 88.6% during FY24Q4; they declined to 71.8% during FY25Q1 (July – September 2024). On average, the Department reports approving expenses for only about 75% of awards. These trends imply growing and systemic backlogs and lengthy approval/reimbursement processes.
Because of a lack of consistent and timely data on the amount of time it takes Department staff to approve reimbursements and whether staff is keeping up with the volume of transactions needing approval, it is difficult to say whether any improvements have been made in the usability and accountability of the ESA program more recently. For example, the decision to automatically approve reimbursement requests of less than $2,000 in December 2024 should have helped alleviate this issue.
CSI has previously reviewed the administration of the ESA program in partnership with Yes. Every Kid. Foundation. That review identified a systemic bias towards treating all ESA users and all ESA transactions as potentially suspect, and a focus on preventing perceived waste, fraud or abuse, instead of a focus on administering a successful public program consistent with law and good practice. The standards used to track ESA funds have been more onerous and strict than comparable state and federal funded programs such as Medicaid, SNAP, and unemployment insurance .
The Department of Education staff must review each purchase, order, and reimbursement for the ESA program. In Quarter 4 of 2024 alone, there were 1,300 applications, 155,000 reimbursements, and 475,000 orders individually reviewed by Department staff.[vi] Each of these transactions are subject to the same process of review and pre-approval, regardless of amount or scope. For example, the Department requires its limited staff resources to individually review and approve 38,449 purchases of “curriculum”.[vii] The average purchase amount? $93.
In order to make the program more usable and to reduce the backlog of transactions needing approval each quarter, the Department of Education must move to a risk-based auditing approach that automatically deems most valid and complete purchase requests approved pending later review or audit, while identifying unusually, high-dollar, or high-risk transactions for added scrutiny. More recently, the Superintendent has indicated changes consistent with this direction to allow the Department staff to process all transactions in less than 30 days and reduce the 89,000 transaction backlog that Department Staff face; more recently, though, he has suggested this was a temporary measure and implied the Department may go backwards. [viii] [ix]
Part of the reason traditional public options and the state STO program remain relatively popular with parents is their ease of use. Participants are not treated like criminals by default and are required to prove their innocence. Expenditures by District and Charter schools, and School Tuition Organizations, are presumed legitimate. For the ESA program to both survive and grow a similar philosophical realignment may need to occur.
Bottom Line
The rapid “catch-up” growth in the ESA program is coming to an end. Going forward, program growth will probably be much slower, and new enrollments will increasingly reduce the cost of other publicly-funded alternatives. The posture of the programs administrators since universal expansion has been defensive, and driven by this rapid but temporary “catch-up” phase of growth. The result has been a program that’s slow and cumbersome for (disproportionately middle-income) participants to use. A lack of consistent and regular reporting to the public and policymakers has contributed to these issues. Addressing this is key going forward.
[1] Technically, only $7.28 billion of this total was “appropriated”; $2.6 billion in expected property tax contributions are legally accounted for in the K-12 budget but not annually appropriated by the Legislature.
[ii] Fischer, Howard, “Most applying for Arizona vouchers already go to private schools”, Arizona Daily Star, Sept. 8th, 2022.