





October 27, 2026
Introduction
Iowa’s data center sector has grown from a handful of campuses into one of the fastest-growing parts of the state’s local property tax base. In 2014, seven data center campuses were operating or under development in Iowa. By 2025, that number had risen to 17, and current development plans put the state on track for 24 campuses by 2031. As the sector has grown, so has the debate over how to tax it. In 2025, the Iowa Legislature narrowed the sales tax exemptions available to new and expanding data centers through House File 976.[i] In 2026, Ohio and Arizona paused tax exemptions for new data center projects.[ii] Much of that debate centers on the tax relief data centers receive. This report examines the other side of the ledger, which is the taxes data centers pay and what that revenue means for the communities that host them.
This report is a companion to CSI’s October 2026 report, The Economic Impact of Data Centers in Iowa, which estimated the economic impact of Iowa’s data center sector across construction, operations, and future development.[iii] That report measured the jobs, wages, and output the sector supports. This report focuses on the sector’s tax footprint, especially the property taxes data center campuses pay to local levy authorities and how communities have used that revenue.
This report first estimates the property taxes Iowa’s data centers have paid since 2014 and are projected to pay through 2040. It then compares what data center land generates in property taxes with what the same land would generate as farmland. Next, it examines how local governments have used the added revenue, through a statewide analysis of levy rates and case studies of two school districts, and compares taxable sales growth in cities with and without data centers. Finally, it examines how Iowa’s sales tax treatment of data center equipment compares with its treatment of manufacturing equipment and with other states.
Key Findings
Data centers are a large and fast-growing source of local tax revenue.
- Iowa’s data centers paid an estimated $319 million in property taxes to local governments from 2014 through 2025, including $56.1 million in 2025 alone.
- Annual payments are projected to reach at least $140 million by 2031 and $292 million by 2040.
- Cumulative payments could reach about $3.1 billion by 2040, with nearly 90% still to come.
Data center land pays far more in property taxes than it did under its previous use.
- In tax year 2026, an acre of data center land pays about $4,884 in property taxes, compared with about $29 under its previous use due to increased land value and different tax treatment.
- For campuses with available data, data center parcels generated roughly 153 times the property tax in 2025 that the same land would have produced under its previous use. That multiple is projected to rise to about 505 times by 2040.
Data center revenue funds local services and lowers homeowners’ taxes, but local choices determine how much.
- In 2025, data centers paid $56.1 million in property taxes. An estimated $3.4 million of that, about $15 per home, lowered homeowner tax bills. The rest remained available to fund local services or lower other property owners’ bills.
- Homeowners in the Norwalk Community School District saved an estimated $631 per household over three years after Microsoft’s Osmium campus reached the tax rolls. Homeowners in the Waukee Community School District saved about $269 over four years.
Cities with data centers have seen faster growth in local sales, suggesting data centers may increase local economic activity.
- From 2015 through 2025, taxable sales grew 50% in Iowa cities with a data center and 32% in cities without one.
Iowa taxes data center equipment less favorably than manufacturing equipment.
- Manufacturing machinery is exempt from sales tax by right, while data center equipment is exempt only through a conditional, tiered incentive.
- Of the 41 states that exempt manufacturing equipment by right, only two—New York and West Virginia—do the same for data centers.
- States with by-right exemptions have drawn 0.32 MW of planned capacity per square mile, double the 0.16 MW of conditional-exemption states such as Iowa.
Property Tax Payments from Iowa’s Data Centers
Property taxes are the most direct way data centers contribute to the communities that host them. Unlike state income and sales taxes, property taxes in Iowa are levied and spent locally. They fund the counties, cities, school districts, and other levy authorities that serve the area around each campus. Iowa’s local governments also rely on property taxes more heavily than most, drawing about 85% of their tax revenue from them.[iv] As a result, a large addition to the local property tax base can meaningfully change what a local government collects, what it asks of other taxpayers, or both.
Iowa has seen this dynamic play out before. In its February 2026 report, Iowa’s Renewable Advantage: Driving Jobs, Growth, and Property Tax Relief, CSI estimated that wind and solar facilities paid roughly $1.22 billion in property taxes to Iowa’s local governments between 2010 and 2025.[v] That revenue did more than add to local budgets. School districts with more wind turbines tended to set lower voted levy rates, and an average residential property owner in a district with average wind production paid an estimated $194 less in property taxes than one in a district with no turbines.[vi] The report’s county case studies also found that median homeowner property taxes rose faster in comparable counties without wind development than in wind-producing counties. At the same time, the report found that some local governments used wind revenue to increase spending rather than lower rates. In other words, a large new source of taxable value can lighten the load on other taxpayers, expand local budgets, or both.
Data centers now play a similar role, though they add to the tax base in ways that set them apart from most other development. Campuses tend to be built in phases, so their taxable value grows as each new building and improvement reaches the tax rolls. Some campuses also receive local property tax abatements in their early years.[vii] An abatement is a temporary reduction in the property tax owed on new construction, granted by the city or county where a project is located.[viii] Abatements are not automatic, however. Under Iowa’s industrial property tax exemption, a city council or county board of supervisors must first hold a public hearing and approve a project by ordinance.[ix]
Cities can also offer relief through tax increment financing (TIF) agreements. Under a TIF agreement, the project pays its full property tax bill, but the taxes on new value above a set base go to the city rather than to the county, school district, and other local governments.[x] The city then uses that money to pay for public improvements that serve the site, such as roads and utilities, or rebates part of it to the developer for a set period. Like abatements, TIF agreements are negotiated project by project and require city council approval. When an abatement ends, more of a campus’s value becomes taxable. When a TIF agreement ends, the value does not change, but its taxes begin flowing to all local governments. Of the 20 campuses in CSI’s analysis that are currently operating or under construction, 15 received a local property tax abatement or TIF agreement.
To measure that contribution, CSI assigned each Iowa data center campus a taxable value for every year from 2014 through 2040. Values through 2025 draw on county assessor records, public announcements, and news reporting. Later years are projected from announced investment and the standard phase-in of taxable value. CSI then applied the combined levy rate of every taxing authority that overlaps each campus, net of abatements, to estimate the property tax the campus pays. Appendix A describes the forecast in greater detail.
Data centers have become a significant and growing source of local property tax revenue in Iowa. Figure 1 shows annual property tax payments from data centers from 2014 through 2040, with actual estimates through 2025 and projections thereafter. These estimates include only the 20 campuses with enough data to forecast property tax payments. Four projects fall outside this group, including major developments such as Tract Altoona’s planned 1,000 MW campus. As a result, actual property tax collections in 2040 will likely exceed CSI’s estimate, assuming these projects move forward.
Figure 1.
Source: CSI analysis
In 2014, the seven data center campuses then operating or under development paid an estimated $3.7 million in property taxes. By 2020, that figure had risen to $19.5 million. Only two new campuses entered development over that period, so most of the growth came from continued expansion at existing campuses in Council Bluffs, Altoona, and West Des Moines. New campuses then accelerated the trend. In 2025, 17 campuses were operating or under development; CSI estimates they paid $56 million in property taxes to local levy authorities that year alone. Current development plans put Iowa on track for 24 campuses operating or under development by 2031. Twenty of those campuses have sufficient data to forecast property tax payments.[xi] Counting only those 20, CSI estimates annual property tax collections will reach at least $140 million in 2031.
Data center campuses will continue to develop their facilities after 2031. Property tax abatements will also begin to expire for select campuses, which adds newly taxable valuation to local levy authorities’ rolls. As a result, CSI estimates that annual statewide property tax payments from data centers will rise from $56 million in 2025 to $292 million by 2040. That is a more than fivefold increase, or average growth of about 11.6% per year. Figure 2 forecasts cumulative property tax payments from data centers through 2040.
Figure 2.
Source: CSI analysis
From 2014 through 2025, data centers paid an estimated $319 million in property taxes to Iowa’s local levy authorities. CSI projects cumulative payments will rise to roughly $3.1 billion by 2040. Nearly 90% of that total, about $2.8 billion, falls in the 2026–40 period. In other words, most of the local tax benefit from Iowa’s data center sector lies ahead, as campuses now under construction come online and abatements on existing campuses expire.
These totals show how much data centers pay, but not how much of that revenue is new. Before construction, most campus sites were already on the tax rolls, typically as farmland or undeveloped land, and they paid property tax in that use. The net gain to a community is the difference between what a parcel pays as a data center and what it would have continued to pay otherwise. The next section measures that difference.
Data Centers Versus Farmland
Every data center campus replaces an earlier use of the land, and in Iowa that earlier use is usually agriculture. Iowa assesses farmland on its productive value, and the formula does not consider what the land would sell for.[xii] As a result, farmland generates far less property tax per acre than commercial property such as a data center, as the comparisons below show. Comparing the two uses shows how much additional tax base a campus creates on the same acreage. This section first compares the property tax each data center parcel generates with what the same land would have generated in its prior use. It then separates that gap into two parts. The first measures the higher value the property carries as a data center. The second considers the different way Iowa taxes agricultural versus commercial property. Together, the two comparisons show how much of the data center advantage in local tax revenue generation reflects the economic use of the land and how much reflects tax policy.
Property Taxes
A data center campus adds to the local tax base only to the extent that it pays more than its land would have paid without development. The statewide totals in the “Property Tax Payments from Iowa’s Data Centers” section do not net out that baseline. For most campuses, that baseline is the property tax the land generated as farmland. To measure the difference, Figure 3 restates CSI’s property tax estimates as a ratio of the tax generated by each data center parcel to what the same land would have generated had it stayed in its prior, mostly agricultural use. A ratio of 100, for example, means the parcels generate 100 times the property tax they would have produced as farmland.
Figure 3.
Source: CSI analysis
Note: Select campuses include Meta Davenport, QTS Cedar Rapids, Microsoft Alluvion, Microsoft Ginger East, Microsoft Ginger West, Microsoft Mountain, Microsoft Osmium, Microsoft Van Meter, and Apple Waukee. Campuses lacking an established counterfactual land value or a confirmed valuation and development timeline are excluded.
In 2025, the last year with available assessor tax records, Iowa’s data center parcels generated roughly 153 times the property tax they would have produced as farmland. CSI projects the multiple will reach approximately 505 times by 2040. The multiple rises over time because the two sides of the ratio grow at very different rates. CSI projects that property taxes from the select campuses will grow from $35 million in 2025 to $130 million by 2040, an average increase of about 9.1% per year as new campuses and later phases reach the tax rolls. The same land in agricultural use would have generated roughly $234,000 in property tax in 2025, rising to roughly $265,000 by 2040. In other words, the gap between data center and farmland uses widens each year because new construction keeps adding to the data center tax base, while the agricultural baseline grows only as farmland values grow.
Readers should treat the size of the multiple as an indication of scale rather than a precise measure. Because the agricultural baseline is so small, modest changes in assumed farmland values or growth rates can move the multiple considerably. A ratio of 153 or 505 therefore reflects the limited tax base of farmland as much as the large tax base of data centers. Even so, the direction of the finding holds under any reasonable set of assumptions. Converting farmland to data center use raises the property tax those parcels generate. Appendix A details how CSI constructed the counterfactual and its assumptions. The multiple does not show, however, how much of that increase comes from the higher value of land in data center use and how much comes from the different way Iowa taxes agricultural and commercial property. The next subsection separates those two effects.
Separating Land Value from Tax Treatment
Because Iowa does not tax farmland and commercial property under the same rules, a like-for-like comparison of land uses requires holding tax treatment constant. Under Iowa law, agricultural land is assessed on its productive (use) value rather than its market value, has its own rollback percentage, and is generally not subject to city levies.[xiii] As a result, part of the property tax multiple reflects tax policy rather than differences in economic use.
CSI therefore divides the property tax multiple into two components: a value multiple and a tax-treatment differential. The value multiple uses assessed value, rather than taxes paid, as a proxy for each use’s economic value, allowing CSI to estimate the comparison under equal tax treatment.
Table 1 shows the tax rate for the same land under each use. The campuses sampled in this section differ from those in figure 3 because of data availability. The table reports the effective property tax rate, defined as property tax liability divided by assessed value, for farmland and data center use across the sample campuses in select tax years.
Table 1. Effective Property Tax Rate by Land Use, Select Tax Years

Source: CSI analysis
Note: Sample campuses include Meta Davenport, Apple Waukee, QTS Cedar Rapids, Microsoft Van Meter, and Microsoft Mountain.
Data center property faces roughly twice the effective tax rate of farmland. Two features of Iowa law produce that gap: the state assessment rate, or “rollback,” and the local levy rate. The Iowa Department of Revenue sets the agricultural rollback each year so that statewide growth in agricultural taxable value from revaluation does not exceed 3%.[xiv] Commercial and industrial property, by contrast, has carried a rollback fixed in statute since 2013. Lawmakers set it at 95.0% for assessment year (AY) 2013 and 90.0% from AY 2014 through AY 2021.[xv] Beginning with AY 2022, the first $150,000 of value is assessed at the residential rollback, with remaining value assessed at 90.0%.[xvi] For AY 2025 (FY 2027), the rollback was 59.4401% for agricultural property versus 90.0% for commercial value above $150,000.[xvii]
Total levies on each class of property also affect effective tax rates. Agricultural land outside city limits is generally not subject to city levies, and agricultural land inside a city is limited to a reduced city levy of $3.00375 per $1,000.[xviii] Data center campuses, most of which sit inside city limits, pay the full city levy along with county, school, and other levies. In the sample, the rollback difference accounts for a modest share of the gap. Most of the difference in effective tax rates comes from the higher combined levy rates data centers face. The effective rate for data centers rises slightly over time, mainly because campuses in higher-levy jurisdictions make up a growing share of property values in the sample as data centers are built out. Table 2 applies these rates to per-acre values to show how much of the property tax gap remains after equalizing tax treatment.
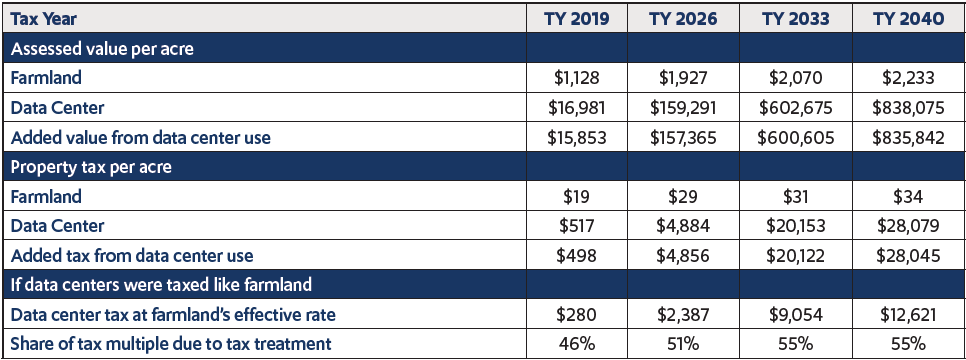
Table 2. Per-Acre Assessed Value and Property Tax by Land Use, Select Tax Years
Source: CSI analysis
Note: Assessed values and property taxes are across 3,605 acres. Sample campuses include Meta Davenport, Apple Waukee, QTS Cedar Rapids, Microsoft Van Meter, and Microsoft Mountain.
If data centers were taxed like farmland, they would pay roughly half as much property tax per acre as they currently do. In TY 2026, for example, the sample campuses would pay about $2,387 per acre instead of $4,884. Even under the same tax treatment, however, data centers would pay about 82 times as much in taxes per acre as farmland in 2026 and an estimated 370 times as much by 2040. That difference reflects the increase in land use value when developers convert agricultural land to commercial land for a data center.
If the effective rate of the land stayed the same when converted from agricultural land to commercial land, the sample data centers would increase the local tax revenue per acre from about $29 per acre to an estimated $2,387 per acre in TY 2026. In the sample, data center development raised the land’s assessed value from about $1,900 per acre to about $159,000. The farmland figure reflects Iowa’s productivity-based assessment, not what farmland sells for. In 2025, farmland in Polk County was valued at an average of about $12,200 per acre.[xix] By TY 2040, as the buildout of the sampled campuses increases the land’s value, an acre in data center use would carry roughly $838,000 of assessed value, compared with about $2,200 as farmland. Even at farmland’s effective rate, that acre would pay about $12,600 in property tax, compared with $34 as farmland.
This comparison measures intensity of land use, not total economic contribution. Statewide, agriculture remains Iowa’s largest source of employment and GDP because of the sheer scale of land in production.[xx] In 2025, the nine data center campuses analyzed in figure 3 paid $35.2 million in property taxes to local governments—roughly 150 times the estimated $235,000 the same land would have generated as farmland. On an acre-for-acre basis, however, data center usage supports substantially more assessed value and more property tax revenue for local governments. These are different metrics, and one does not diminish the other. The larger tax base data centers create raises a separate question about how local governments use the added revenue. The next section examines whether taxing entities lower rates, expand spending, or some of both.
How Local Governments Use Data Center Revenue
A larger tax base does not lower anyone’s tax bill on its own. Local governments decide how much of the added revenue to return to taxpayers through lower rates and how much to put toward additional spending. This section first estimates how levy rates respond across Iowa’s local taxing entities as data center property tax payments rise. It then follows two school districts through the years their data centers reached the tax rolls and compares each with peer districts that have no data center property. It closes with a descriptive comparison of taxable sales growth in cities with and without data centers.
Data Centers Lower Property Tax Rates
Data centers contribute large sums to the property tax base of Iowa’s local governments. If local governments pass part of this growing data center tax base through to taxpayers, levy rates should fall as data center payments rise. CSI tests this hypothesis through a simple regression of changes in property tax rates on changes in data center property tax payments. The results suggest that local taxing entities at least partially reduce their tax rates as the tax base expands through data center development. The regression estimate of -0.0367 is statistically significant.[1] In practical terms, for every $1 million increase in data center taxes paid in the previous year, there is a $0.0367 smaller increase, or larger decrease, in the levy rate this year, holding the model’s other included factors constant. For a $250,000 home in a jurisdiction with a data center, which is taxed on about $111,336 after Iowa’s 44.53% residential rollback, each $1 million increase in data center taxes paid lowers the property tax bill by about $4.09 (−0.0367 × $111,336 ÷ $1,000), relative to the model’s otherwise-predicted change.[xxi]
Table 3. Property Tax Savings per $1 Million in Data Center Taxes, by Home Market Value

Source: CSI analysis
According to the findings in table 3, each additional $1 million in data center property taxes paid in the prior year within a taxing district lowers the typical homeowner’s annual property tax bill in the subsequent year by $3.92, assuming a typical $240,000 home taxed at the 44.53% residential rollback.[xxii] For a small business owner with a $1 million commercial property, which is taxed on about $832,000 after Iowa’s commercial rollback, the same $1 million in data center taxes yields savings of roughly $30.53 per year. Because these savings scale with the amount of data center taxes paid in each district, the total benefit depends on the location of each campus.
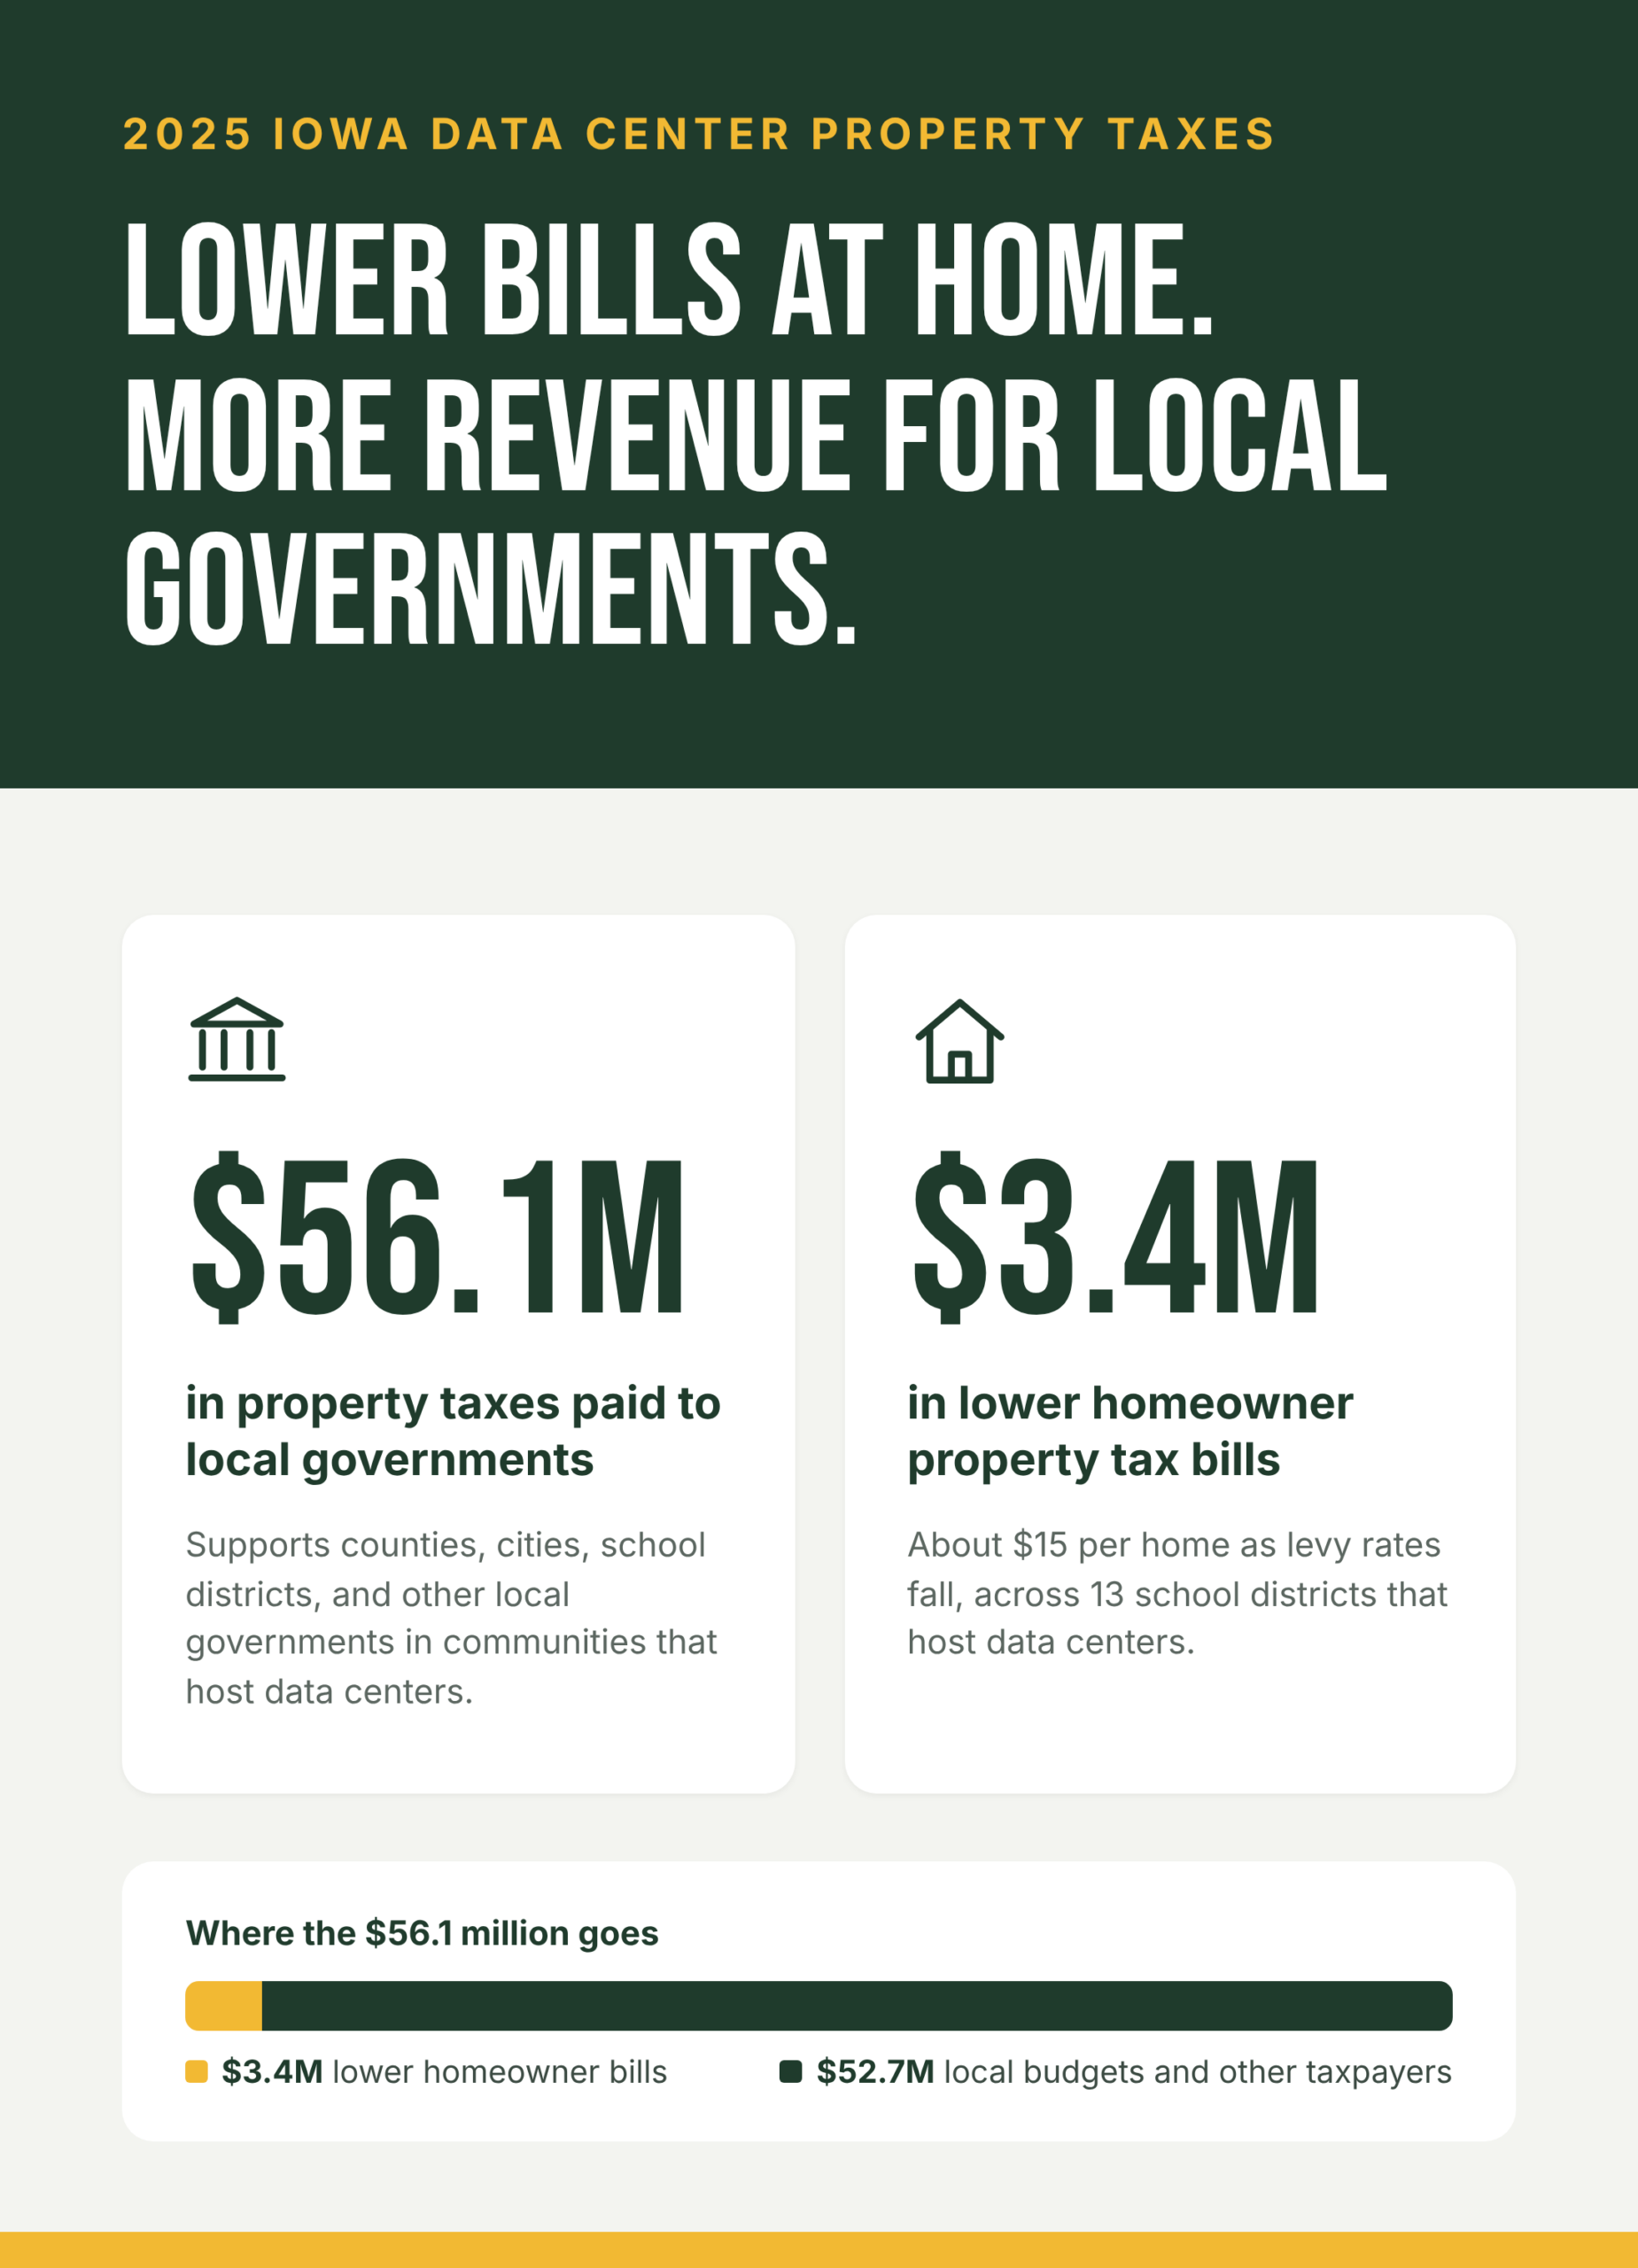
To estimate how much data center taxes lower homeowners’ property tax bills, CSI applies the table 6 estimate to the 13 Iowa school districts that host data center campuses. CSI uses owner-occupied households in each district as a proxy for affected homeowners and applies each district’s 2025 data center property tax payments to its own households. Figure 4 compares the estimated homeowner savings with the total property taxes data centers paid to local governments that year.
Figure 4.
Source: CSI analysis
As Figure 4 shows, homeowner savings are modest compared with the new revenue data centers generate for local governments. Across roughly 226,000 owner-occupied homes in these districts, the $56.1 million in data center property taxes paid in 2025 lowers homeowners’ property tax bills by an estimated $3.4 million the following year, or about $15 per home on average.[xxiii] Homeowner savings account for about 6% of data center payments. The remaining $52.7 million, about 94%, supports local government budgets or lowers tax bills for businesses, farms, and other property owners, whose savings this estimate does not include. These estimates capture only the direct, measured property tax savings from 2025 data center payments. Appendix B provides further details on the regression model.
Community Case Studies
The regression shows how levy rates respond on average across Iowa’s taxing entities, but not how any single community used its expanded tax base. This section tests whether communities that host data centers end up with stronger tax bases and lighter residential tax burdens than similar communities without them. The analysis pairs two central Iowa school districts that recently added large data center value with groups of districts that have none. It then compares each before and after the data centers reached the tax rolls.
The design builds on CSI’s February 2026 report, Iowa’s Renewable Advantage: Driving Jobs, Growth, and Property Tax Relief, which used county case studies to measure the local fiscal effects of wind energy.[xxiv] That report compared two wind counties with similar counties that had none, pairing Adams County with Ringgold County and O’Brien County with Lyon County. Each pair was similar in population size, rural economic structure, and reliance on agriculture but differed meaningfully in renewable energy development. That approach worked because wind development is spread widely across rural Iowa. As of tax year 2024, wind farms contributed to the property tax bases of 51 counties, leaving a large pool of comparable counties with and without wind farms. That pool made it possible to find county pairs in which wind development was the primary factor driving tax revenue growth and levy rate changes.
Data centers do not offer the same sample quality. About 96% of Iowa’s mapped data center capacity sits in three metro areas—Des Moines, Cedar Rapids, and Council Bluffs. The counties that host most of that capacity, such as Polk and Linn, are among the largest and most economically diverse in the state. Many other factors drive changes in these counties’ tax bases, making it difficult to isolate the effect of data centers. No set of Iowa counties offers a clean comparison. The one proposed campus outside a metro, Applied Digital’s planned facility near Adair, could eventually support the kind of rural county pairing the renewables report used. That campus has not yet been built, however, and it does not appear on the tax rolls.
Narrowing the comparison to school districts offers two advantages. First, a smaller unit isolates the data center more effectively. In a county the size of Polk, new commercial, industrial, and residential development constantly adds to the tax base, and each project has its own small effect on levy rates. A single data center campus makes up a much larger share of a school district’s taxable value, so its effect on the district’s levy is easier to separate from that background activity. Second, school districts matter most for local taxpayers. They collect more property tax than any other type of levy authority in Iowa—about 40% of all property taxes in FY2026.[xxv]
When a large new property joins a district’s tax base, the district can collect the same dollars at a lower rate, collect more dollars at the same rate, or do some of both. The case studies below examine which of these paths each district took. The two cases are Norwalk Community School District, home to Microsoft’s Osmium campus, and Waukee Community School District, home to Microsoft’s Mountain campus and Apple’s Waukee facility. Each is compared with the average of five Iowa districts with similar populations and no data center property.
The analysis also accounts for a two-year lag between tax year and fiscal year. Property is valued as of January 1 of each tax year, and school districts levy on those values in the fiscal year that begins 18 months later. For example, values set January 1, 2023, are taxed in FY2025, which runs July 2024 through June 2025, with payments due in September and March. A data center therefore affects a school district’s levy about two years after it first appears on the tax rolls.
To estimate what the data centers meant for local residents, CSI compares each district’s change in school levy rate after its data center arrived with the change in the peer-district average over the same years. The difference approximates how much lower the host district’s rate is than it would have been had it followed the peer trend. To express that effect in dollars for households, CSI multiplies the rate difference by the district’s residential taxable value, including residential property in TIF areas, and divides the result by the number of households in the district using U.S. Census Bureau estimates.[xxvi] Savings to commercial and industrial property, including the data centers themselves, are excluded. These estimates are descriptive rather than causal. School levy rates also respond to enrollment, state aid, debt service, and other factors. Even at the school district level, this section does not fully isolate data centers from those influences.
Norwalk Community School District
Norwalk Community School District is home to Microsoft’s Osmium campus, whose value first entered the district’s levy in FY2025.[xxvii] That timing gives the district a clear before-and-after window. Comparing Norwalk’s levy rate with those of similar districts on either side of FY2025 shows whether the district’s rate followed a different path once the campus reached the tax rolls. Figure 5 tracks Norwalk’s school district levy rate against the average rate of five peer districts from FY2018 through FY2027. Lewis Central, Dallas Center-Grimes, North Scott, Pella, and Fort Madison serve as the peer comparison districts. CSI selected these five peers because they have population sizes comparable to Norwalk’s and no data center property on their tax rolls.[xxviii]
Levy rates come from the Iowa Department of Management, which publishes the rate each school district certifies per $1,000 of taxable value.[xxix] The rate represents the most direct and uniform measure of the tax a district levies on each dollar of local property; it best demonstrates whether new data center value lowered the tax burden. Comparing Norwalk with a peer average rather than a single district also helps separate the effect of Osmium from statewide forces that move all school levies, such as changes in state school aid, while smoothing out one-time swings in any one district. The dotted vertical line marks FY2025, the first fiscal year in which Osmium’s value entered Norwalk’s levy.
Figure 5.
Source: Iowa Department of Management, CSI analysis
Note: Taxable values are assessed January 1 of each tax year and levied in the fiscal year two years later (e.g., TY2023 values fund FY2025). Peers are five districts with comparable population sizes and no data centers: Lewis Central, Dallas Center-Grimes, North Scott, Pella, Fort Madison.
Norwalk entered the period with a higher school levy rate than its peers, and the two moved largely in parallel until the Osmium campus reached Norwalk’s levy. Between FY2018 and FY2024, Norwalk’s rate fell from $20.16 to $18.50 per $1,000 of taxable value, a decline of 8.2%. The peer average fell from $15.01 to $13.26 over the same years, a decline of 11.7%. Throughout those six years, Norwalk’s rate sat between $5.04 and $5.42 above the peer average.
That pattern broke once tax revenue from Osmium began entering district coffers in FY2025. Norwalk’s rate fell to $18.37 in FY2025, $17.62 in FY2026, and $16.56 in FY2027—a decline of $1.94, or 10.5%, from FY2024. In three years, Norwalk’s rate fell more than it had in the six years before. Meanwhile, the peer average rose from $13.26 to $13.73, an increase of 3.5%. As a result, the gap between Norwalk and its peers narrowed from $5.24 in FY2024 to $2.83 in FY2027, a 46% reduction. This suggests Norwalk Community School District spread its levy across a larger base and effectively lowered the rate for all property taxpayers. Table 4 presents CSI’s estimate of what that relative decline meant for Norwalk taxpayers.
Table 4. Data Center School Taxes and Estimated Residential Savings per Household Relative to Peer Trend, Norwalk Community School District, FY 2025 to FY 2027

Source: CSI analysis
In FY2025, the first year Norwalk collected taxes on Osmium’s value, the campus paid school district property taxes equal to an estimated $763 per household. That figure eased to $738 in FY2026 and $692 in FY2027, for a cumulative $2,193 per household over three fiscal years. As the district’s rate fell, household savings rose. Relative to the peer trend, residential savings per household grew from $42 in FY2025 to $189 in FY2026 and $400 in FY2027, a cumulative $631. By FY2027, estimated residential savings equaled about 58% of that year’s data center school taxes per household, up from about 6% in FY2025. Over the full three years, savings equaled about 29% of the data center’s contribution. These figures count only residential property, so they understate the total rate relief, which also reached businesses, farms, and other property owners. In other words, Norwalk has increasingly passed on the benefit of data center revenues to taxpayers through property tax rate reductions. Norwalk added a single campus. Waukee, a larger district, added two.
Waukee Community School District
Waukee Community School District (WCSD) faces the same test, but with two campuses that reached the tax rolls a year apart. Figure 6 tracks WCSD’s levy rate against the average rate of five peer districts from FY2018 through FY2027. The peers are Waterloo, Dubuque, Sioux City, Ames, and Linn-Mar. CSI selected these five peers because they have population sizes comparable to Waukee’s and no data center property on their tax rolls.[xxx] As with Norwalk, levy rates come from the Iowa Department of Management, and the peer average helps separate the effect of WCSD’s data centers from statewide forces that move all school levies while smoothing out one-time swings in any one district.[xxxi] Because of that staggered timing, the figure includes two dotted vertical lines. The first marks FY2024, the first fiscal year in which Microsoft’s Mountain campus entered WCSD’s levy, and the second marks FY2025, when Apple’s Waukee facility followed.[xxxii]
Figure 6.
Source: Iowa Department of Management, CSI analysis
Note: Taxable values are assessed January 1 of each tax year and levied in the fiscal year two years later (e.g., TY2022 values fund FY2024), when the taxes are paid. Peers are five districts with comparable population sizes and no data centers: Waterloo, Dubuque, Sioux City, Ames, Linn-Mar
Waukee Community School District’s levy rate followed a different path from its peers’ well before either data center arrived. Between FY2018 and FY2023, WCSD held its rate nearly flat, edging down from $17.86 to $17.80 per $1,000 of taxable value, a decline of 0.3%. The peer average fell from $15.41 to $14.27 over the same years, a decline of 7.4%. As a result, the gap between WCSD and its peers widened from $2.45 in FY2018 to $3.53 in FY2023. Unlike Norwalk, WCSD did not move in parallel with its peers before its data centers came online.
Following the introduction of the Microsoft and Apple facilities, WCSD’s rate held at $17.80 in FY2024 and FY2025, then fell to $17.76 in FY2026 and $17.49 in FY2027—a decline of $0.31, or 1.7%, from FY2023. Meanwhile, the peer average rose from $14.27 to $14.68, an increase of 2.9%, though it moved unevenly, falling back to $14.27 in FY2025 before jumping to $14.84 in FY2026. The gap between WCSD and its peers narrowed from $3.53 in FY2023 to $2.81 in FY2027, a 20% reduction that reversed about two-thirds of the earlier widening. More than half of that narrowing came from rising peer rates rather than from Waukee’s own rate falling. This suggests WCSD largely held its rate steady and used its larger base to support additional levy dollars, with only a modest rate reduction in the most recent two years. Table 5 presents CSI’s estimate of what that relative decline meant for WCSD taxpayers.
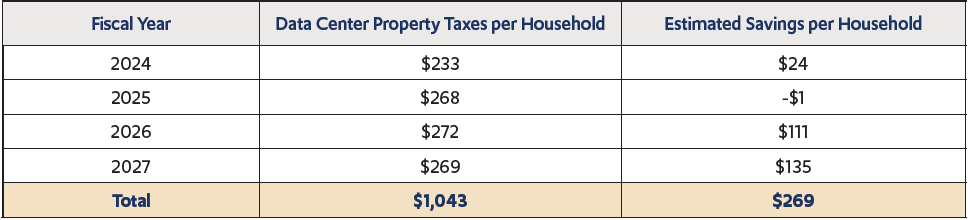
Table 5. Data Center School Taxes and Estimated Residential Savings per Household Relative to Peer Trend, Waukee Community School District, FY 2024 to FY 2027
Source: CSI analysis
Data center property paid an estimated $233 per household in WCSD school district property taxes in FY2024, the first year Microsoft’s Mountain campus entered the levy. That figure rose to $268 in FY2025 as Apple’s Waukee facility followed, then held near that level at $272 in FY2026 and $269 in FY2027, for a cumulative $1,043 per household over four fiscal years. Estimated savings followed a less steady path than in the Norwalk case study. Relative to the peer trend, savings per household were $24 in FY2024 and essentially zero in FY2025, a year in which neither WCSD’s rate nor the peer average differed from FY2023 levels. Savings then grew to $111 in FY2026 and $135 in FY2027, for a cumulative savings of $269 per household. By FY2027, estimated savings equaled about 50% of that year’s data center school taxes per household, up from about 10% in FY2024. Over the full four years, savings equaled about 26% of the data center contribution. WCSD began passing a larger share of data center revenue through to taxpayers only in the two most recent years.
These two case studies suggest that a data center expands what a district can collect, while the district’s own choices determine how much of that capacity reaches residents as lower rates.
Taxable Sales
Property is not the only local tax base data centers may affect. Construction crews, permanent staff, and the suppliers that serve a campus also spend money in host communities, and that spending shows up in taxable sales. Taxable sales also matter for local budgets, since most Iowa cities and counties levy a local option sales tax at 1%.[xxxiii] This section compares taxable sales growth in Iowa cities with and without data centers. Figure 7 shows growth in taxable sales from 2015, or from the year a city’s first data center began operating, through 2025.[2]
Figure 7.
Source: Iowa Department of Revenue, Aterio
From 2015 through 2025, taxable sales grew 50% on average in cities with at least one data center compared with 32% in cities without one. This simple comparison of taxable sales across cities does not attempt to explain all the factors that cause taxable sales in one city to grow faster than taxable sales in another city. It does show that cities with at least one data center typically see faster growth in taxable sales. The comparison does not estimate how much of that difference stems from data centers. Data centers also affect sales tax more directly through the tax Iowa applies to or exempts from the equipment and electricity they buy. The next section examines that treatment within the tax code.
Sales Tax and Exemptions
Sales tax treatment is one of the most direct ways a state shapes the cost of building and operating a data center. Because servers and networking equipment are replaced periodically and electricity is consumed continuously, sales tax on these inputs is a recurring cost over the life of a facility rather than a one-time charge at construction.[xxxiv] How a state taxes those purchases therefore affects both the initial decision to build and the ongoing cost of expanding or upgrading an existing campus.[xxxv] This section examines how Iowa taxes data center purchases and how that treatment compares with both Iowa’s treatment of manufacturers and the approaches taken in other states.
Iowa applies its sales tax unevenly across two industries that, in economic terms, look much alike. Machinery and equipment used directly in manufacturing are exempt from Iowa sales tax by right.[xxxvi] This means no investment threshold, application, or discretionary approval is required. Conversely, data center equipment is exempt only through a conditional, tiered incentive.[xxxvii] A facility that commits at least $200 million in qualifying investment receives full exemption on computers, equipment, electricity, and backup power generation fuel.[xxxviii] Facilities that invest at least $10 million, or $5 million in a rehabilitated building, can claim a 50% refund for seven to 10 years, while facilities that invest at least $1 million can claim a 50% refund for up to five years.[xxxix] In 2025, however, the Iowa Legislature narrowed the exemption limits through House File 976.[xl] As of June 6, 2025, new or expanding data centers are subject to new sales tax exemption limits.[xli] The sales tax exemptions for electricity and backup power generation fuel will now expire for new or expanding data centers 10 to 15 years into operation. The exact timeline depends on whether the data center is in a city with more or less than 30,000 residents.[xlii] Existing data centers will not be subject to these exemption limits.
This gap between data center and manufacturer treatment is not unique to Iowa. Forty-one states exempt manufacturing machinery and equipment by right.[xliii] Only two of those states, New York and West Virginia, extend an equivalent “by-right” exemption to data center equipment.[xliv] The remaining states either rely on conditional incentives that are also layered with items such as investment minimums, job requirements, and energy conditions, or they provide no exemption at all.[xlv]
Judged against established tax-policy principles, this distinction has little economic basis. Public finance scholars broadly agree that an ideal sales tax falls on final consumption and exempts the inputs businesses use in production.[xlvi] A manufacturer’s machinery and a data center’s servers perform the same economic function. Neither constitutes a finished product sold to the end user. Rather, each is a capital input a firm uses to produce a good or service that is sold and taxed further down the line.[xlvii] Taxing that equipment at the point of purchase embeds an additional layer of tax in the final price. This layering of tax upon tax, known as tax pyramiding, raises consumer prices, turns part of the sales tax into a tax on in-state investment, and steers firms toward choices driven by tax exposure rather than efficiency.[xlviii] By that standard, exempting data center equipment is consistent with sound sales tax design—the same treatment manufacturers already receive by right—rather than a special tax break. Indeed, data centers in Iowa receive somewhat less favorable treatment than manufacturers, since they must meet investment thresholds to claim an exemption that manufacturers receive automatically.[xlix]
Differences in state sales tax treatment also line up with where developers plan new data center capacity. Figure 8 shows planned data center capacity, measured in megawatts per square mile and grouped by how each state treats data center equipment under its sales tax laws. Planned capacity figures come from Cleanview.[l] Each state’s sales tax classification, ranging from full by-right exemption to fully taxed, comes from the National Taxpayers Union’s state-by-state classification of how each state taxes data center equipment.[li] Normalizing capacity by land area allows researchers to compare states of very different sizes on a common basis. This way, a large state does not appear more attractive to data center developers simply because it has more room to build. Appendix C provides more information on the classifications listed in figure 8.
Figure 8.
Source: Cleanview, National Taxpayers Union, U.S. Census Bureau, CSI analysis
States that exempt data center equipment by right have drawn the most planned capacity per square mile at 0.32 MW. Only two states, New York and West Virginia, fall into this category. The next largest category, conditional exemptions, applies to 31 states. This category allows exemptions to data centers under certain parameters. Iowa falls into this category due to its investment threshold requirement. States with conditional exemptions have drawn 0.16 MW of planned capacity per square mile, half that of by-right states. Nonetheless, data center planned capacity per square mile in conditional-exemption states is still double that of states that fully tax data center equipment.
Ten states fall into the “taxed” category. Three of these states—Hawaii, Rhode Island, and Vermont—have zero planned capacity.[lii] Two—Arizona and Ohio—previously exempted data center equipment through incentive programs but recently paused those exemptions for new projects.[liii] In May 2026, Ohio Governor Mike DeWine directed the state’s Tax Credit Authority to stop considering new data center tax exemption requests until a legislative committee completes a study of data center growth in the state.[liv] In June 2026, Arizona enacted a three-year moratorium on new data center incentives as part of its budget, subjecting equipment purchases by new facilities to the state’s transaction privilege tax.[lv] Neither pause bars data center construction itself, but both raise the cost of building a new facility by subjecting its equipment purchases to sales tax. These two states alone make up 78.4% of all planned capacity for fully taxed states at a combined 36,209 MW.[lvi] Five states—California, Colorado, New Jersey, Oklahoma, and South Dakota—make up the remaining 21.6% of planned capacity for fully taxed states.
States offering only partial abatements, or refunds, have even less planned capacity per square mile, at 0.06 MW. Two states, Alabama and Nevada, fall under this category.
Notably, under Iowa’s 2025 law, smaller-scale data centers under $200 million in investment also receive only a partial refund.[lvii] Iowa is nonetheless categorized under conditional exemption due to providing a threshold for full sales tax exemptions.
The final category, no sales tax, has the lowest planned capacity per square mile. Five states fall into this category—Alaska, Delaware, Montana, New Hampshire, and Oregon. However, Delaware and New Hampshire have zero planned capacity. These comparisons are descriptive. Planned capacity also reflects electricity prices, land and water availability, fiber access, and other factors and incentives. The pattern is nonetheless consistent with the principle that taxing business inputs raises the cost of investment and thus discourages it.
Bottom Line
A little over a decade ago, Iowa’s data center sector consisted of a handful of campuses, most of them on plots previously classified as agricultural land. Today, data centers are a significant and growing source of local property tax revenue, and most of their contribution still lies ahead. That growth reflects a basic change in land use in Iowa. Converting vacant land or farmland to data center use multiplies the value of each acre, and with it the property tax that land pays.
What that growth means for Iowans depends on decisions made well beyond the data center itself. A larger tax base gives local governments room to lower tax rates, increase spending, or both. Iowa communities with data center property tax revenues have taken each approach to varying degrees. Some have passed a growing share of the new revenue through to residents as lower tax bills. Others have held rates steady and put the larger base toward additional spending. Data centers create the fiscal capacity, and local officials decide how much of it reaches taxpayers.
Meanwhile, state policy influences how much new data center capacity Iowa develops. The state treats the servers inside a data center less favorably than the machinery inside a factory, even though both are inputs to production. Nationally, states that exempt data center equipment by right have drawn the most planned capacity per square mile. Debates over data centers often center on the tax relief they receive rather than the tax base they create. How Iowa weighs that relief against the revenue data centers generate will help determine whether its data center growth becomes a lasting fiscal asset for the communities that host it.
Appendix A: Methodology for Property Taxes
Property Taxes
In this report, Common Sense Institute estimates the property taxes paid by Iowa’s data centers in each tax year from 2014 through 2040. The estimate is built by first assigning each data center campus in Iowa a taxable value for every year in the study period. The underlying taxable valuation and taxes-paid data are compiled from a mix of publicly available sources—including news reporting and government announcements—and online county-level assessor databases. Values in earlier years reflect assessed valuations drawn from these records as facilities were built and came online. Values in years beyond the current assessment cycle are projected from announced and committed campus investment and the standard phase-in of taxable value. For each campus and year, CSI then assembles the full set of overlapping taxing jurisdictions that levy against the property—county, city, school district, county assessor, and other authorities. The analysis then sums their individual levy rates into a single consolidated rate.
From there, the property tax generated by a campus equals its taxable value multiplied by the consolidated rate. CSI allocates that total among the individual taxing authorities in proportion to each authority’s share of the consolidated rate. This means that every jurisdiction is credited with only the portion of the campus’s tax it levies. Where applicable, the analysis also factors in property tax abatements and similar incentive arrangements.
Several assumptions and limitations bear on the results. Because the taxable valuation and taxes paid data are assembled from a combination of public sources and county-level assessor databases, coverage and precision may vary across campuses and years. Forecasted levies past the most recent available year are also static and do not change over time. The analysis covers the identified data center campuses for which a taxable value and an operational timeline could be established. Several known projects are excluded because they lack a confirmed development timeline or valuation at the time of analysis, including Cielo Des Moines (Cielo Digital Infrastructure, Polk County), the Applied Digital Adair data center (Adair County), Project Lola (Edged, Pottawattamie County), and Tract Altoona (Tract, Polk County). As these projects advance and assessed values become available, their inclusion would increase the totals reported.
Alternative Land Usage
Common Sense Institute expresses each year’s data center property taxes as a multiple of what the same land would have generated under its prior use. For every tax year from 2014 through 2040, the multiple is the ratio of two figures. In the numerator is the property tax paid by Iowa’s data center campuses. In the denominator is the “counterfactual” property tax. This counterfactual is an estimate of what those same parcels would have paid had they remained in their pre-development, mostly agricultural use. A multiple of 200, for example, means a parcel developed as a data center generates roughly 200 times the property tax it would have produced as farmland.
The numerator is the annual data center property tax described in the preceding subsection, carried forward unchanged. It reflects the taxable value of each included campus multiplied by its consolidated levy rate, summed across the campuses in the analysis for that year. The denominator is built parcel by parcel. For each campus, CSI establishes the property tax the underlying land generated under its prior agricultural use, anchored to assessed valuations drawn from county assessor records in the years for which they are available. From those anchor years, the counterfactual series is extended in both directions. Earlier years are back-cast and later years are projected forward using a parcel-specific annual land-value growth rate. That growth rate is derived from the observed trend in each parcel’s own historical counterfactual values over the period for which records exist. Where a parcel lacks sufficient history of its own, the rate is set to the average of comparable parcels. The resulting per-parcel counterfactual taxes are summed to a statewide counterfactual for each year, and the multiple is that year’s data center tax divided by that counterfactual total, rounded to a whole number.
Several assumptions bear on the multiple. Because the counterfactual represents a use that did not occur, the estimate is anchored to pre-development assessor records and extrapolated using modest, parcel-specific growth rates. The magnitude of the multiple is therefore driven as much by the smallness of the agricultural baseline as by the size of data center taxes, and it is sensitive to the assumed counterfactual land-value growth. The multiple covers only the campuses for which both a data center taxable value and a counterfactual land value could be established, and it excludes the same projects excluded from the dollar estimates.
Appendix B: Property Tax Regression Estimates
Presented in the body of the report is a regression estimating the correlation between data center property tax payments and overall property tax rates across jurisdictions. The regression models take the following forms (version 1 and version 2). Version 1 uses the prior year lag in data center taxes to estimate the year-over-year (YoY) change in the property tax rate. Version 2 applies no lag. In general, as shown by the statistical significance star (*), the increase in taxes paid from data centers has a stronger effect on lowering tax rates one year after the taxes paid than in the year in which the data center pays taxes.

The results follow. Overall, the -0.0367 on L.Annual change in DC taxes paid, millions implies that as taxes paid by data centers increase, the tax rate in those taxing jurisdictions with data center revenue generally goes down faster.
CSI attempted numerous regression specifications. The following regression result is not intended to be a final, unchanging estimate of the effect of data center development on property tax rates. It does, though, speak to the common sense understanding that when the tax base expands, taxing entities either use the money for lower tax rates or additional spending.
Table 6. Regression Estimates of the Annual Change in Total Levy Rate
| (1) | (2) | |
| Annual change in total levy rate | Annual change in total levy rate | |
| L.Annual change in DC taxes paid, millions | -0.0367* | |
| (0.0146) | ||
| Annual change in DC taxes paid, millions | -0.0107 | |
| (0.00871) | ||
| Taxable valuation year=2016 | 0 | 0.0202 |
| (.) | (0.0376) | |
| Taxable valuation year=2017 | -0.00840 | 0.0123 |
| (0.0319) | (0.0312) | |
| Taxable valuation year=2018 | 0.0140 | 0.0346 |
| (0.0299) | (0.0297) | |
| Taxable valuation year=2019 | 0.0147 | 0.0348 |
| (0.0339) | (0.0335) | |
| Taxable valuation year=2020 | -0.0359 | -0.0162 |
| (0.0347) | (0.0342) | |
| Taxable valuation year=2021 | -0.0954** | -0.0764** |
| (0.0290) | (0.0292) | |
| Taxable valuation year=2022 | -0.00368 | 0.197*** |
| (0.0306) | (0.0344) | |
| Taxable valuation year=2023 | 0.183*** | 0.200*** |
| (0.0392) | (0.0393) | |
| Taxable valuation year=2024 | 0.0553 | 0.0745* |
| (0.0332) | (0.0334) | |
| Taxable valuation year=2025 | -0.145*** | -0.126** |
| (0.0386) | (0.0389) | |
| Taxable valuation year=2015 | 0 | |
| (.) | ||
| Constant | -0.00306 | -0.0224 |
| (0.0226) | (0.0228) | |
| Observations | 14320 | 17023 |
| Adjusted R2 | 0.006 | 0.008 |
Source: CSI analysis
Appendix C: State Sales Tax Treatment of Data Center Equipment
In this report, Common Sense Institute groups the 50 states by how each one treats data center equipment under its sales tax laws. The underlying classifications come from the National Taxpayers Union (NTU), which assigns each state a category based on whether purchases of data center equipment are taxed, exempted, refunded, deducted, or partially abated, and whether that relief requires the facility to meet program conditions.[lviii] The NTU uses 10 distinct classifications, several of which apply to only one or two states. To allow meaningful comparison across groups, CSI consolidates these into five categories, shown in the third column of table 7.
Table 7.
Source: National Taxpayers Union, CSI analysis
Note: * Arizona and Ohio had exemptions through incentives (discretionary in Ohio), but recently adopted a moratorium on data center exemptions,
† Multi-tenant facilities are exempt by right, while single-tenant facilities are exempt through an incentive program,
‡ Washington no longer exempts data center replacement equipment,
§ Wyoming offers a two-tier exemption, with a narrower range of exempt equipment for smaller data centers.
The five consolidated categories are defined as follows. “Exempt – By Right” covers states that exempt data center equipment from sales tax without an investment threshold, application, or discretionary approval. Only New York and West Virginia fall into this category. “Exempt – Conditional” covers states that provide full sales tax relief on data center equipment only to facilities that meet program requirements such as investment minimums, job creation targets, or energy conditions. Thirty-one states, including Iowa, fall into this category. “Taxed” covers the 10 states that apply their full sales tax rate to data center equipment. “Partial Abatement” covers the two states, Alabama and Nevada, that reduce but do not eliminate the tax owed on qualifying purchases. “No Sales Tax” covers the five states that levy no general statewide sales tax.
These consolidated categories are paired with planned data center capacity drawn from Cleanview.[lix] For each category, CSI sums the planned capacity, measured in megawatts, across every state in the group. It then divides that total by the combined land area of the same states, using land area data from the U.S. Census Bureau.[lx] The result is the planned capacity per square mile for each category. Normalizing by land area keeps large states from appearing more attractive to developers simply because they have more room to build. The comparison shows how planned capacity differs across tax treatments. It does not isolate sales tax treatment as the cause of those differences, since access to power, land, water, fiber, and other factors also shape decisions.
Endnotes
[1] The overall adjusted R2 of the model is 0.006. At face value, the model explains 0.6% of the variation in property tax rates across taxing entities in Iowa. To some statisticians, this might seem low. The intent of this regression analysis, however, was not to explain every possible factor that causes tax rates to differ by taxing entity. Rather, the intent was to see if property tax rates may be lower because of the presence of data centers. The p-value on the change in data center property taxes paid suggests data centers save property taxpayers money.
[2] In cases where a city did not have a data center in 2015 but later saw the activation of a data center, growth is measured from the year the data center began operating through 2025.
[i] “House File 976,” 91st General Assembly, Iowa Legislature, State of Iowa, 2025, https://www.legis.iowa.gov/legislation/BillBook?ga=91&ba=HF976.
[ii] “Governor DeWine Announces Pause of Data Center Tax Exemption,” Office of the Governor, State of Ohio, May 27, 2026, https://governor.ohio.gov/media/news-and-media/governor-dewine-announces-pause-of-data-center-tax-exemption; Caitlin Sievers, “Arizona’s $18.3B Budget Passes with $1.4B in Trump Tax Cuts and a Data Center Freeze,” Arizona Mirror, June 11, 2026, https://azmirror.com/2026/06/11/arizonas-18-3b-budget-passes-with-1-4b-in-trump-tax-cuts-and-a-data-center-freeze/.
[iii] Thomas Young, Andrzej Wieciorkowski, and Ben Murrey, “The Economic Impact of Data Centers in Iowa,” Common Sense Institute Iowa, October 21, 2026, https://commonsenseinstituteus.org/research/the-economic-impact-of-data-centers-in-iowa/.
[iv] Ben Murrey and Andrzej Wieciorkowski, “Iowa’s Largest Property Tax Reform in Decades Changes the U.S. Tax Burden Map,” Common Sense Institute Iowa, June 5, 2026, https://www.commonsenseinstituteus.org/iowa/research/taxes-and-fees/iowas-largest-property-tax-reform-in-decades-changes-the-us-tax-burden-map.
[v] Thomas Young, Ben Murrey, and Andrzej Wieciorkowski, “Iowa’s Renewable Advantage: Driving Jobs, Growth, and Property Tax Relief,” Common Sense Institute Iowa, February 19, 2026, https://www.commonsenseinstituteus.org/iowa/research/energy-and-our-environment/iowas-renewable-advantage.
[vi] Thomas Young, Ben Murrey, and Andrzej Wieciorkowski, “Iowa’s Renewable Advantage: Driving Jobs, Growth, and Property Tax Relief,” Common Sense Institute Iowa, February 19, 2026, https://www.commonsenseinstituteus.org/iowa/research/energy-and-our-environment/iowas-renewable-advantage.
[vii] “Iowa Code § 427B.1,” Iowa Legislature, State of Iowa, accessed October 2026, https://www.legis.iowa.gov/docs/code/427B.1.pdf.
[viii] “Iowa Code § 427B.1,” Iowa Legislature, State of Iowa, accessed October 2026, https://www.legis.iowa.gov/docs/code/427B.1.pdf; “Iowa Code Chapter 404, Urban Revitalization,” Iowa Legislature, State of Iowa, accessed October 2026, https://www.legis.iowa.gov/docs/code/404.pdf.
[ix] “Industrial Property Tax Exemption,” Application and Instructions, Iowa Department of Revenue, State of Iowa, accessed October 2026, https://revenue.iowa.gov/media/2396/download; “Iowa Code § 427B.4, Application for Exemption,” Iowa Legislature, State of Iowa, accessed October 2026, https://www.legis.iowa.gov/docs/code/427B.4.pdf.
[x] “Iowa Code Chapter 403, Urban Renewal,” Iowa Legislature, State of Iowa, accessed October 2026, https://www.legis.iowa.gov/docs/code/403.pdf.
[xi] The four excluded projects are Cielo Des Moines, the Applied Digital Adair Data Center, Project Lola, and Tract Altoona.
[xii] “Iowa Code § 441.21, Actual, Assessed, and Taxable Value,” Iowa Legislature, State of Iowa, accessed October 2026, https://www.legis.iowa.gov/docs/code/441.21.pdf; “Assessment Limitations — Property Value Rollbacks,” Fiscal Services Division, Iowa Legislative Services Agency, January 7, 2026, https://www.legis.iowa.gov/docs/publications/FTNO/1543666.pdf.
[xiii] “Assessment Limitations — Property Value Rollbacks,” Fiscal Services Division, Iowa Legislative Services Agency, January 7, 2026, https://www.legis.iowa.gov/docs/publications/FTNO/1543666.pdf; “Iowa Code § 384.1, Taxes Certified,” Iowa Legislature, State of Iowa, accessed October 2026, https://www.legis.iowa.gov/docs/code/384.1.pdf.
[xiv] “Assessment Limitations — Property Value Rollbacks,” Fiscal Services Division, Iowa Legislative Services Agency, January 7, 2026, https://www.legis.iowa.gov/docs/publications/FTNO/1543666.pdf; “Iowa Code § 441.21, Actual, Assessed, and Taxable Value,” Iowa Legislature, State of Iowa, accessed October 2026, https://www.legis.iowa.gov/docs/code/441.21.pdf.
[xv] “Rollbacks – 2014 Property Tax Assessment Limitations,” Fiscal Update, Fiscal Services Division, Iowa Legislative Services Agency, November 15, 2014, https://www.legis.iowa.gov/docs/publications/FU/403136.pdf; “Assessment Limitations — Property Value Rollbacks,” Fiscal Services Division, Iowa Legislative Services Agency, January 7, 2026, https://www.legis.iowa.gov/docs/publications/FTNO/1543666.pdf.
[xvi] “Assessment Limitations — Property Value Rollbacks,” Fiscal Services Division, Iowa Legislative Services Agency, January 7, 2026, https://www.legis.iowa.gov/docs/publications/FTNO/1543666.pdf.
[xvii] “Assessment Limitations — Property Value Rollbacks,” Fiscal Services Division, Iowa Legislative Services Agency, January 7, 2026, https://www.legis.iowa.gov/docs/publications/FTNO/1543666.pdf.
[xviii] “Iowa Code § 384.1, Taxes Certified,” Iowa Legislature, State of Iowa, accessed October 2026, https://www.legis.iowa.gov/docs/code/384.1.pdf.
[xix] Rabail Chandio, “Comparative Iowa Land Values by County, 2024–2025,” Center for Agricultural and Rural Development, Iowa State University, December 9, 2025, https://farmland.card.iastate.edu/files/inline-files/Comparative%20Iowa%20Land%20Values%20Table%20with%20Maps.pdf.
[xx] Andrzej Wieciorkowski and Ben Murrey, “As Agriculture Goes, So Goes Iowa: The Full Footprint of the State’s Farm Economy,” Common Sense Institute Iowa, October 6, 2026, https://commonsenseinstituteus.org/research/as-agriculture-goes-so-goes-iowa-the-full-footprint-of-the-states-farm-economy/.
[xxi] “Iowa Property Tax Rollback Adjustments,” Legislative Services Agency, State of Iowa, accessed October 2026, https://www.legis.iowa.gov/docs/publications/FCTA/1529552.pdf.
[xxii] “Iowa Housing Market: 2026 Home Prices & Trends,” Zillow Home Value Index, Zillow, accessed October 2026, https://www.zillow.com/home-values/19/ia/.
[xxiii]“Households and Families, Table S1101,” American Community Survey 5-Year Estimates, United States Census Bureau, United States Department of Commerce, accessed October 2026, https://data.census.gov/table/ACSST5Y2024.S1101?q=owner+occupied+households&g=9700000US1906510,1906540,1907860,1908220,1908580,1908970,1921240,1923110,1926820,1929010,1930510,1930930,1931860&moe=false.
[xxiv] Thomas Young, Ben Murrey, and Andrzej Wieciorkowski, “Iowa’s Renewable Advantage: Driving Jobs, Growth, and Property Tax Relief,” Common Sense Institute Iowa, February 19, 2026, https://www.commonsenseinstituteus.org/iowa/research/energy-and-our-environment/iowas-renewable-advantage.
[xxv] “Property Tax & Tax Replacement,” Iowa Department of Management, State of Iowa, accessed September 2026, https://dom.iowa.gov/local-government/property-tax-tax-replacement.
[xxvi]“Households and Families, Table S1101,” American Community Survey 5-Year Estimates, United States Census Bureau, United States Department of Commerce, accessed October 2026, https://data.census.gov/table/ACSST5Y2024.S1101?q=owner+occupied+households&g=9700000US1906510,1906540,1907860,1908220,1908580,1908970,1921240,1923110,1926820,1929010,1930510,1930930,1931860&moe=false; “Property Valuations,” Iowa Department of Management, State of Iowa, accessed October 2026, https://dom.iowa.gov/local-government/property-valuations.
[xxvii] FY2025 marks the first fiscal year in which the Osmium campus made a significant contribution to Norwalk Community School District’s property tax base. CSI uses that year as the dividing point for the comparison.
[xxviii] “Small Area Income and Poverty Estimates (SAIPE) Program,” United States Census Bureau, United States Department of Commerce, accessed October 2026, https://www.census.gov/programs-surveys/saipe.html.
[xxix] “Property Tax & Tax Replacement,” Iowa Department of Management, State of Iowa, accessed September 2026, https://dom.iowa.gov/local-government/property-tax-tax-replacement.
[xxx] “Small Area Income and Poverty Estimates (SAIPE) Program,” United States Census Bureau, United States Department of Commerce, accessed October 2026, https://www.census.gov/programs-surveys/saipe.html.
[xxxi] “Property Tax & Tax Replacement,” Iowa Department of Management, State of Iowa, accessed September 2026, https://dom.iowa.gov/local-government/property-tax-tax-replacement.
[xxxii] FY2024 and FY2025 mark the first fiscal years in which Microsoft’s Mountain campus and Apple’s Waukee facility, respectively, made a significant contribution to Waukee Community School District’s property tax base. CSI uses those years as the dividing points for the comparison.
[xxxiii] “Iowa Code § 423B.1, Authorization — Election — Imposition and Repeal,” Iowa Legislature, State of Iowa, accessed October 2026, https://www.legis.iowa.gov/docs/code/423B.1.pdf.
[xxxiv] Jared Walczak, “State Taxation of Data Centers,” Tax Foundation, December 19, 2025, https://taxfoundation.org/research/all/state/data-centers-taxation.
[xxxv] Pete Sepp and Jared Walczak, “Sound Policies, Not Subsidies: Data Center Equipment Tax Exemptions,” National Taxpayers Union, July 22, 2026, https://www.ntu.org/publications/detail/sound-policies-not-subsidies-data-center-equipment-tax-exemptions.
[xxxvi] “Iowa Code § 423.3(47), Exemptions,” Iowa Legislature, State of Iowa, accessed October 2026, https://www.legis.iowa.gov/docs/code/423.3.pdf.
[xxxvii] “Iowa Code § 423.3(95), Exemptions,” Iowa Legislature, State of Iowa, accessed October 2026, https://www.legis.iowa.gov/docs/code/423.3.pdf.
[xxxviii] “Data Center Sales and Use Tax Incentives,” Iowa Department of Revenue, State of Iowa, November 3, 2025, https://revenue.iowa.gov/taxes/tax-guidance/sales-use-excise-tax/data-centers.
[xxxix] “Data Center Sales and Use Tax Incentives,” Iowa Department of Revenue, State of Iowa, November 3, 2025, https://revenue.iowa.gov/taxes/tax-guidance/sales-use-excise-tax/data-centers.
[xl] “House File 976,” 91st General Assembly, Iowa Legislature, State of Iowa, 2025, https://www.legis.iowa.gov/legislation/BillBook?ga=91&ba=HF976.
[xli] “Immediate Iowa Tax Law Changes for Data Centers,” Nyemaster Goode, P.C., June 2025, https://nyemaster.com/news/immediate-iowa-tax-law-changes-for-data/; “Iowa Sales Tax Changes for Data Centers,” BrownWinick Law Firm, June 13, 2025, https://www.brownwinick.com/insights/iowa-sales-tax-changes-for-data-centers.
[xlii] “Immediate Iowa Tax Law Changes for Data Centers,” Nyemaster Goode, P.C., June 2025, https://nyemaster.com/news/immediate-iowa-tax-law-changes-for-data/.
[xliii] Pete Sepp and Jared Walczak, “Sound Policies, Not Subsidies: Data Center Equipment Tax Exemptions,” National Taxpayers Union, July 22, 2026, https://www.ntu.org/publications/detail/sound-policies-not-subsidies-data-center-equipment-tax-exemptions.
[xliv] Pete Sepp and Jared Walczak, “Sound Policies, Not Subsidies: Data Center Equipment Tax Exemptions,” National Taxpayers Union, July 22, 2026, https://www.ntu.org/publications/detail/sound-policies-not-subsidies-data-center-equipment-tax-exemptions.
[xlv] Pete Sepp and Jared Walczak, “Sound Policies, Not Subsidies: Data Center Equipment Tax Exemptions,” National Taxpayers Union, July 22, 2026, https://www.ntu.org/publications/detail/sound-policies-not-subsidies-data-center-equipment-tax-exemptions.
[xlvi] Jared Walczak, “Modernizing State Sales Taxes: A Policymaker’s Guide,” Tax Foundation, September 5, 2024, https://taxfoundation.org/research/all/state/state-sales-tax-reform-guide/.
[xlvii] Jared Walczak, “Modernizing State Sales Taxes: A Policymaker’s Guide,” Tax Foundation, September 5, 2024, https://taxfoundation.org/research/all/state/state-sales-tax-reform-guide/.
[xlviii] “Tax Pyramiding,” TaxEDU, Tax Foundation, accessed October 2026, https://taxfoundation.org/taxedu/glossary/tax-pyramiding; Jared Walczak, “Modernizing State Sales Taxes: A Policymaker’s Guide,” Tax Foundation, September 5, 2024, https://taxfoundation.org/research/all/state/state-sales-tax-reform-guide/.
[xlix] Pete Sepp and Jared Walczak, “Sound Policies, Not Subsidies: Data Center Equipment Tax Exemptions,” National Taxpayers Union, July 22, 2026, https://www.ntu.org/publications/detail/sound-policies-not-subsidies-data-center-equipment-tax-exemptions.
[l] “Free Data Center Tracker Tool,” Cleanview, accessed September 2026, https://cleanview.co/data-centers.
[li] Pete Sepp and Jared Walczak, “Sound Policies, Not Subsidies: Data Center Equipment Tax Exemptions,” National Taxpayers Union, July 22, 2026, https://www.ntu.org/publications/detail/sound-policies-not-subsidies-data-center-equipment-tax-exemptions.
[lii] “Free Data Center Tracker Tool,” Cleanview, accessed September 2026, https://cleanview.co/data-centers.
[liii] Pete Sepp and Jared Walczak, “Sound Policies, Not Subsidies: Data Center Equipment Tax Exemptions,” National Taxpayers Union, July 22, 2026, https://www.ntu.org/publications/detail/sound-policies-not-subsidies-data-center-equipment-tax-exemptions.
[liv] “Governor DeWine Announces Pause of Data Center Tax Exemption,” Office of the Governor, State of Ohio, May 27, 2026, https://governor.ohio.gov/media/news-and-media/governor-dewine-announces-pause-of-data-center-tax-exemption.
[lv] Caitlin Sievers, “Arizona’s $18.3B Budget Passes with $1.4B in Trump Tax Cuts and a Data Center Freeze,” Arizona Mirror, June 11, 2026, https://azmirror.com/2026/06/11/arizonas-18-3b-budget-passes-with-1-4b-in-trump-tax-cuts-and-a-data-center-freeze/.
[lvi] “Free Data Center Tracker Tool,” Cleanview, accessed September 2026, https://cleanview.co/data-centers.
[lvii] “Data Center Sales and Use Tax Incentives,” Iowa Department of Revenue, State of Iowa, November 3, 2025, https://revenue.iowa.gov/taxes/tax-guidance/sales-use-excise-tax/data-centers.
[lviii] Pete Sepp and Jared Walczak, “Sound Policies, Not Subsidies: Data Center Equipment Tax Exemptions,” National Taxpayers Union, July 22, 2026, https://www.ntu.org/publications/detail/sound-policies-not-subsidies-data-center-equipment-tax-exemptions.
[lix] “Free Data Center Tracker Tool,” Cleanview, accessed September 2026, https://cleanview.co/data-centers.
[lx] “State Area Measurements and Internal Point Coordinates,” United States Census Bureau, United States Department of Commerce, accessed October 2026, https://www.census.gov/geographies/reference-files/2010/geo/state-area.html.