Introduction
The housing market in Arizona is tight and remains as miserable as ever for new homebuyers even two years after prices peaked and the largest mortgage rate hikes in recent history. Although prices have declined some in recent months, they remain only 5.6% off their July 2022 peak – a consequence of inadequate market supply to meet even current tepid demand. Mortgage rates have declined recently as well (-.88 percentage points) but continue to be well above the 2019 average of 3.93%.
While prices are historically high (relative to 2019 levels and longer-term trends), high prices have failed to induce increased supply (and counterintuitively higher interest rates may even have depressed it), and Arizona’s housing shortfall and pace of permitting have recently leveled out. Existing homeowners largely remain on the sidelines unwilling to give up their low existing mortgage rates, translating to a low volume of sales and fewer homes available to purchase. At the same time, new building activity in Arizona as represented by permitting levels has slid (after peaking at 64,802 units/year in 2021) as builders continue to face high costs for new construction and long delays for new permits, souring the state’s outlook. The introduction of new, low- and mid-tier housing supply through new construction remains the primary mechanism through which Arizona, and indeed the U.S., can address the current housing affordability crisis.
Key Findings
- Arizona’s housing shortfall persists, and although the state was previously making progress in closing that shortfall, the latest data shows that Arizona is losing ground. As of the most current data, CSI estimates that Arizona is facing an immediate housing shortage of 65,721 units – up from the 63,465 estimated for 2023. Given the slowing pace of permitting in the state as well, it would take at least 10 years for Arizona to resolve this deficit.
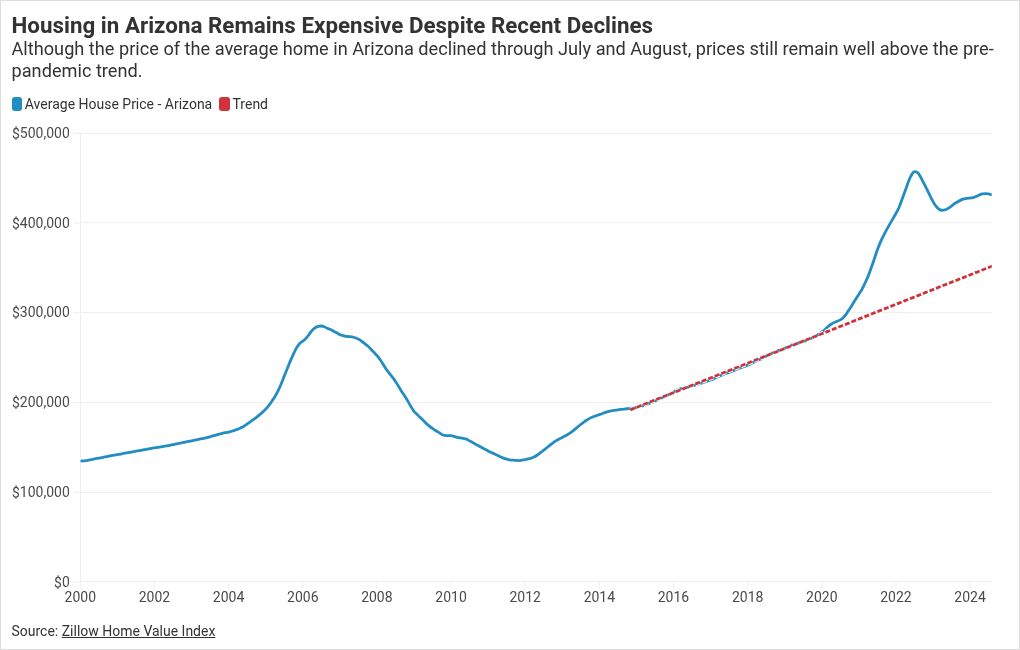
- The average house in 2024 costs nearly $80,000 (+23%) more than it otherwise would have if home prices had maintained the steady pre-pandemic trend. Despite a small decline in prices between July and August, it would still take 41 months for housing prices to fall back in line with the 2012-2019 trend if prices continued to decline at this pace.
- Homeownership remains financially burdensome even despite recent mortgage rate and home price declines. At the prevailing hourly wage rate, it takes around 63 hours of work to afford a monthly mortgage payment. Historically, households in Arizona needed to work about 45 hours/month on average to afford their mortgage payment at current market wages, interest rates, and housing prices. Compared to where housing prices would be if they continued on trend, new homebuyers today face nearly $500 more in monthly mortgage costs, translating into 14 additional hours of work required to service a mortgage today.
- Arizona earned a “C” rating on the CSI Housing Report Card for 2024 – a decline from the previous grade of C+. A combination of various inputs into the health and accessibility of Arizona’s local housing markets, this decline is largely a reflection of the low permitting-to-shortfall ratio and the estimated length of time it will take to close Arizona’s housing deficit.
- Maricopa County – the state’s largest county by population – saw its grade fall to a C- due primarily to the decline in permitting (from a B- in Q1 of 2024). At the current pace of permitting CSI estimates it would take the county over 85 years to close their housing deficit.
- Out of all 15 counties in the state, only one – Greenlee county – earned a perfect A grade. 12 of the 15 counties in Arizona have a projected housing deficit in 2024. Out of those with a deficit, Navajo County has the largest as a share of its total existing housing units (2.94%), while Graham County (0.04%) has the lowest.
Arizona’s Housing Market Remains Paralyzed
Arizona home prices remain high in Q3 despite the still sluggish market. As of August, home prices in the state are just 5.6% below their peak from July 2022 according to data from Zillow, while prices in the Phoenix Metro are 6.8% below their peak. As of August, CSI estimates that the average house in Arizona is nearly $80,000 (23%) more expensive than it otherwise would have been if home prices had maintained their steady pre-pandemic trend. Although prices did fall in July and August, it would still take 41 months for house prices to fall back in line with the 2012-2019 trend if prices continued to decline at this pace. Rather than expressing any discernable trend, prices have instead been range bound since mid-2022, and supply-and-demand are in delicate balance across the housing market; minor movements in prices or interest rates either induce buyers in or push them out, keeping the overall market tightly-bound and mostly paralyzed.
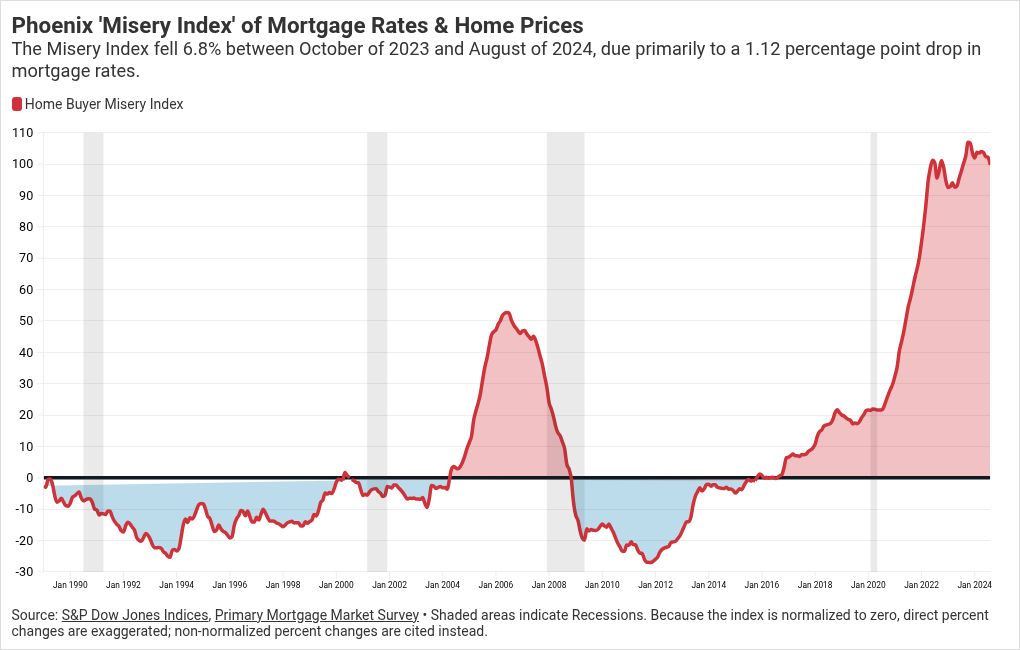
The Homebuyers Misery Index fell for the fourth consecutive month in August to 99.7 (-6.8% since the peak in October 2023) – thanks primarily to a 0.5 percentage-point decline in the average 30-year mortgage rate. As a reminder, the ‘Misery Index’ sums normalized and equally weighted home prices and 30-year mortgage rates to measure effective costs of home buying relative to historical levels. The index is set to a long-run average value of 0. Conditions better than the long-run average are represented with negative numbers, and relatively more expensive conditions with positive values. Interestingly, excluding the two high-volatility periods of the ‘housing market bubble’ in the early 2000s and the current post-pandemic period, the index is relatively flat – generally rising home prices over time have been offset by an almost equally fast decline in interest rates.
Although homebuyers have experienced some relief in the form of falling mortgage rates, those declines have not been large enough to entice current owners to enter the market. The combination of near-record-high home prices and interest rates continues to depress potential home buyers. As a result, sales of existing homes in the western region of the country remain near the lows of the last two years, and the rate as of August is nearly half the rate experienced in 2020.[i]
Changing Market Dynamics – Is Relief Closer or Further?
As discussed in prior CSI reports, the high-interest rate environment experienced in the wake of record inflation acted to cool both demand and supply of housing simultaneously, resulting in relatively muted downward pressure on prices. In a move that surprised many analysts at the time, after rising 50% in just 21 months, home prices fell less than 10% from their all-time peak, before rising again for 14 months in a row between April 2023 and June of 2024 according to Zillow home price data.[ii] Since then, prices have remained rangebound, neither rising nor falling to a significant degree.
Furthermore, the large gap between the mortgage rates possessed by current homeowners and the market rates available to current buyers creates a mortgage lock-in effect – a phenomenon where homeowners are reluctant to sell their current home and buy another due to the higher mortgage costs from high interest rates. As a result, the number of housing transactions plummeted, and new homes as a share of all homes for sale increased 12.2 percentage points between 2019 and 2023 - as of August over a quarter (25.7%) of all homes for sale are new.[iii]
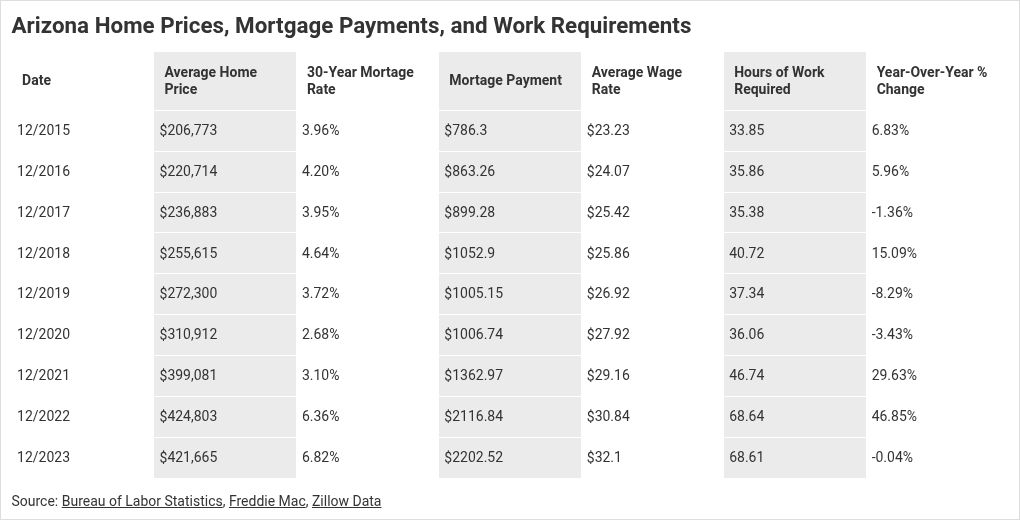
Between May and September, the average 30-year fixed rate mortgage declined 0.88 percentage points, and planned reductions in the federal funds rate may encourage further declines in future rates, albeit with volatility in between. These declines in interest rates translated into annual savings for new homebuyers of nearly $2,500, or 3.4% of the median household’s annual income. As of August, the monthly payment on an average-priced home would be $2,110; at the prevailing hourly wage rate, this would require the typical household to work about 63 hours in total to afford. Unfortunately, data for the first two weeks of October showed mortgage rates rising yet again, demonstrating that federal policy alone is insufficient to maintain falling mortgage rates.
Although the cost of serving a new mortgage is down roughly 12% from its peak in the current cycle, this is well above historical norms. Since 1989, on average in Arizona a household has needed to work about 45 hours/month to meet mortgage service costs at current market wages, interest rates, and housing prices. Although recent interest changes mean that housing is slightly more affordable than during the peak in October of 2023 – when a household would have had to work over 75 hours to afford a new mortgage – mortgage and housing costs remain particularly burdensome for most Arizona households. Compared to where housing prices would be if they continued on trend, new homebuyers today face nearly $500 more in monthly mortgage costs, translating into 14 additional hours of work required to service a mortgage today. For context, assuming basic 28%-35%[iv] loan-to-income rules, mortgage costs become constrained around 72-90 hours/month of required work for the average household – above that and they begin to exceed lending standards.[1]
To the extent that potential homebuyers view the market as more affordable due to falling interest rates, the U.S. is likely to experience flat or even slight increases in housing prices as demand – particularly from buyers who don’t currently own their home – increases. For context, given the rates for a 30-year fixed rate mortgage as of September, housing prices could increase nearly 10% and still not be any less affordable than they were in May of this year. However, given the market’s general resistance to large swings in either direction in the past 2 years, the overall picture is unlikely to change much in the short term.
Arizona’s Housing Shortfall
As CSI previously noted, homebuilding activity reflected in permit counts and new construction rose significantly after 2020 as builders gained optimism from rising demand and prices. Since then, permit activity has slowed and the construction of new housing units in the U.S. began declining in 2024 even as demand for new homes by all accounts remained strong – likely a reflection of the high-cost, high-interest rate environment faced by builders. Recall that we have noted builders are using mortgage-rate subsidies to attract potential buyers, but maintenance of those policies in perpetuity is costly; we may be testing the limits of that cycle and builders may respond to lowering market rates by reducing incentives.[v]
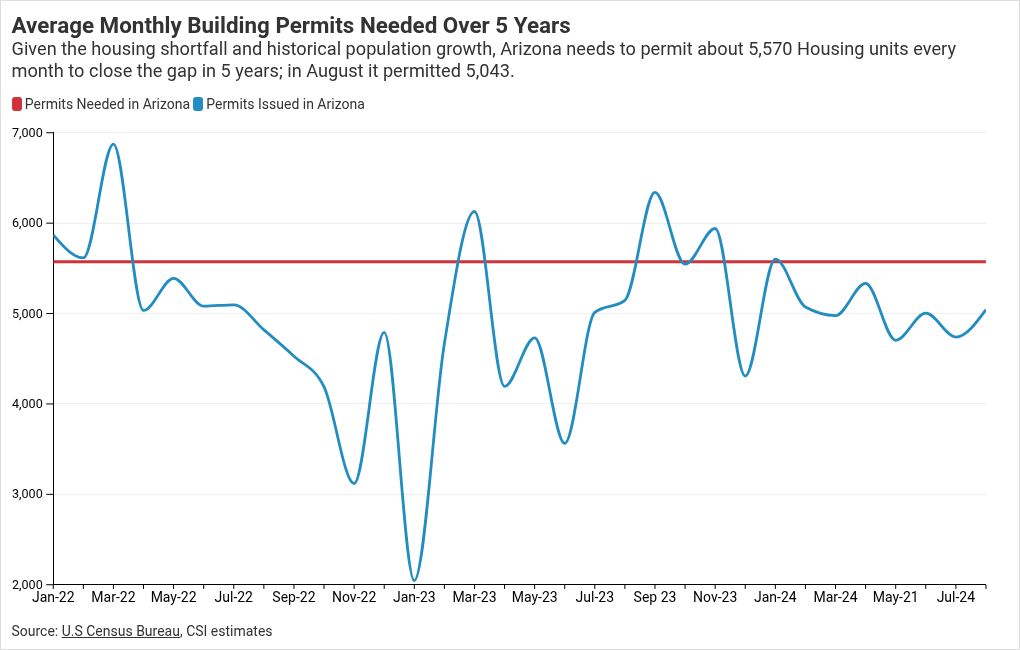
Permitting activity in Arizona surged between 2020 and 2022 as well, helping to close Arizona’s housing gap from an estimated 100,926 units in 2020 to 63,465 by 2023 (the rest of the closure came from reduced demand on the household side). However, as with the U.S. more broadly, permitting fell in Arizona towards the end of 2022, and only briefly recovered before falling again in 2024. A total of 4,919 residential building permits were issued in August. At its recent peak (March of 2022) Arizona issued nearly 6,900 permits.
Permitting activity provides insight into the pace of new homes being supplied into the market, with about a 12-month lead. With resale markets stifled due to high interest rates, the construction of new units has become even more important for meeting the state’s housing needs – especially for lower and medium-priced housing (in a healthy market, new-construction satisfies more of the upper end, while existing homes satisfy more of the mid- to lower-end). And while addressing larger market realities like the cost of construction materials may lie outside the reach of state and local policy, regulatory compliance costs do not. Through permitting, zoning, and other requirements, local governments in Arizona play a substantial policy role in closing the state’s housing deficit.
To assess the pace of permitting, new construction, and overall additions to Arizona’s housing supply in meeting the demands of buyers, CSI Arizona utilizes two measures: a market-based “instantaneous” estimate of the real-time gap between supply and demand informed by vacancy rates, and a housing-supply-focused “cumulative” measure that is slower and less responsive to demand changes but tracks longer-term growth in the housing supply relative to underlying population growth and household formation. For completeness, both results are reported here as a range.
On a real-time basis, currently, CSI estimates an instantaneous housing shortfall of 65,721 units in 2024, up slightly from the revised shortfall of 63,465 in 2023 but still 35% below the 2020 peak. While this decline reflects the uptick in both home permitting and home-building after 2020, it also reflects the collapse in demand as rising prices and interest rates have driven consumers out of the market for homes. This estimate holds given the current state of the market (and particularly continued-high market interest rates coupled with relatively-low-rates for existing homeowners).
Alternatively, CSI publishes a second “cumulative” estimate of the housing shortfall in our annual Free Enterprise Report, which as of 2023 shows a housing deficit of 111,412 in Arizona. This larger shortfall tracks the growth in housing units in the state against the growth in population and other benchmarks, cumulatively and over time. This provides some insight into the state’s likely longer-term needs, if prices and interest rates normalized and more households were drawn into the housing market.
While these estimates differ, they have moved in the same direction over the last several years, confirming the overall need for more housing by any measure – both immediately to satisfy current supply and demand gaps, and more longer-term simply to keep pace with the state’s natural growth. With the number of permits estimated to be issued in 2024, we estimate it will take the state over 10 years to close the housing deficit.
County Level Housing Shortage
12 of the 15 counties in Arizona have a projected housing deficit in 2024. Out of those with a deficit, Navajo County has the largest as a share of its total existing housing units (2.94%), while Graham County (0.04%) has the lowest. Maricopa County – the state’s largest county by population – has a projected deficit of 46,255 units, or 2.37% of the existing housing stock.
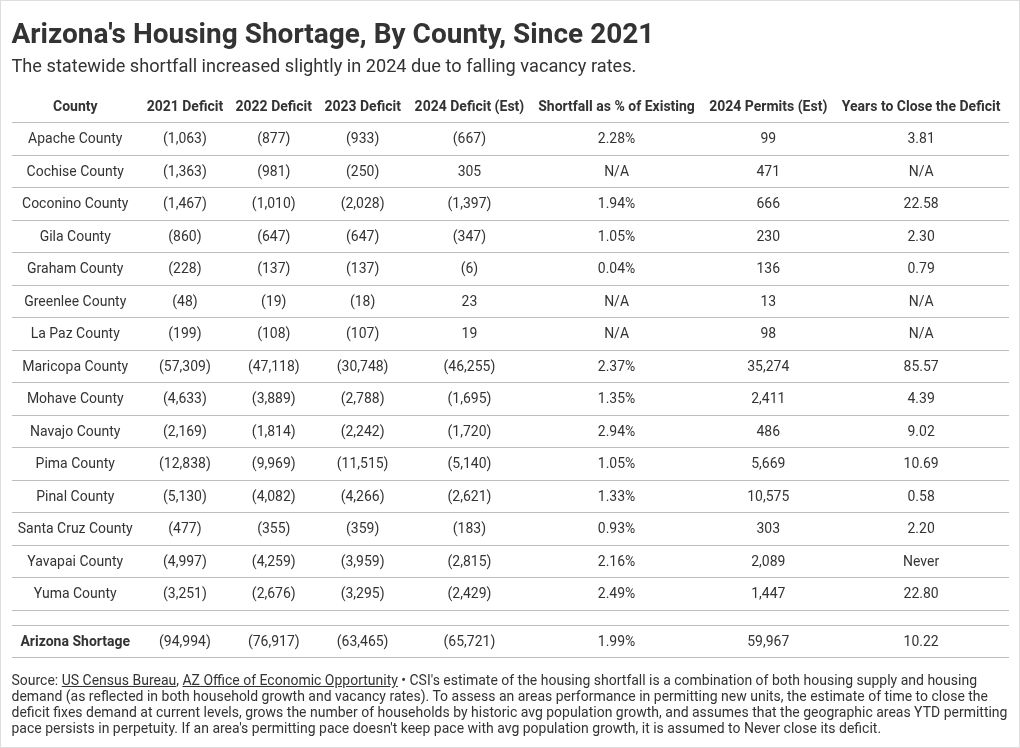
In the state’s largest county, the housing deficit appears to be growing following a dip in permitting activity. Based on Census data, Maricopa County is on track to issue 35,274 permits in 2024, which translates to an estimated 33,158 new housing units this year – roughly 3,000 less than the number from 2023. CSI estimates the county would need to build 32,600 units a year just to keep pace with population growth, leaving only 500 new units annually to contribute to lowering the current deficit of 46,255 housing units. At this pace of permitting, CSI estimates it would take Maricopa County over 85 years to close their current housing shortfall.
Arizona’s Housing Report Card
CSI Arizona debuted its inaugural version of the state’s Housing Report Card in May 2024 – which considering housing market data through Quarter 1 2024. At the time, the state earned an average “C+” letter grade for the overall performance of its local housing markets across four measures of price and supply: cumulative housing price increases, rent to household income ratio, people-per-housing unit, and permitting-to-shortfall ratio.
Since then, the decline in permitting has more than offset any other improvements in local conditions, and the statewide average grade has fallen to a “C”. Given current trends, homebuilding is likely to continue slowing in the short term, unless permitting trends change quickly and dramatically.
Appendix A
Housing Report Card Methodology
This methodology relies on national statistical data collected by various Federal agencies, allowing CSI to develop a consistent and objective grading rubric for Arizona’s fifteen counties and statewide conditions. However, while the letter grades apply to the counties and the state, they should not be interpreted as scores of the County or State governments themselves. Instead, local permitting jurisdictions – typically a city or town, but occasionally the local County government – have the most immediate influence over the ability of developers and builders to rapidly and affordably bring to market the types of housing people are willing to buy. The more restrictive these local development and permitting processes, the slower newer housing comes to market, and the more different (typically more expensive) it may end up looking compared to what people are looking for.
To assess these processes, CSI measured local performance across the four subject areas – cumulative price increases since 2020, rent-to-income ratios, the number of people-per-housing unit, and the pace of home permitting relative to its housing needs – relative to national and long run norms. A weighted average of these four units produces the area’s final overall grade. Because this index is intended to primarily assess how permissive to development a region is, we double weight the pace of home permitting relative to an area’s housing needs.
For each metric, all counties and the state were compared to the national average plus or minus a set number of standard deviations to yield the letter grades. Areas more than a full standard deviation below the national average received a 4.0 (A); one standard deviation below to 0.33 standard deviations above 3.0 (B); 0.33 standard deviations above to one full standard deviation above 3.0 (C); between one and two standard deviations above 1.0 (D); and higher than two standard deviations 0.0 (F).
Cumulative price increases: Areas were graded on their cumulative price increases since 2000 relative to the national average of 194.4% growth. Areas with less than 138% growth (one full standard deviation below average) earned an A, while areas with price growth exceeding 307% (two full standard deviations above the national average) received an F.
Rent-to-Income Ratio: Rent-to-income ratios for each area were compared to the national average of 20.4%. Counties with ratios below 17.21% earned an A grade, with counties over 26.83% earning an F.
People-per-housing unit: The average number of people-per-household in the U.S. was 2.35 in 2023. Counties with less than 2.19 people per household received an A, and counties over 2.67 people per household received an F.
Permitting to shortfall: Counties and the state were compared to the historical average time a county would take to close its housing given historical permitting rates. Counties that were estimated to take less than 3.7 years to close their deficit earned an A, while counties exceeding 58.1 years earned an F.
Figure 8 below provides an example of the grading for the pace of home permitting relative to each area’s housing needs. The more permits an area issues the shorter the time frame to close the estimated housing deficit – all else equal – which results in a higher letter grade.
[1] Assuming 1.5 full-time workers per household, working a total of ~257 hours in a month (40 hrs/week each for 4.29 weeks)