

October 19, 2026

Experts:
Breast Cancer Awareness Month: Colorado Spotlight
Introduction
About one in eight American women, and roughly one in 755 men, will be diagnosed with breast cancer in their lifetime. Excluding skin cancers, it is the most commonly diagnosed cancer among women in the United States, and more than 4 million breast cancer survivors live in the U.S. today, including more than 54,000 Colorado women diagnosed with breast cancer since 2001.[i] Breast cancer touches families and communities across Colorado. This year alone, the American Cancer Society projects that 5,210 Colorado women will be diagnosed with breast cancer and 710 will lose their lives to it.
Real progress has been made in the past few decades in diagnosis and treatment. The national breast cancer mortality rate has fallen 44% since 1989, and in Colorado, falling mortality rates since 1999 have saved an estimated 3,400 lives. Colorado also reports some of the most favorable cancer outcomes in the country.
For Breast Cancer Awareness Month, this report examines how often breast cancer occurs in Colorado compared with other states, how those rates have changed over time, what stage zero breast cancer is and how it is counted, how the disease affects men, how Colorado’s survival and mortality compare nationally, and what the disease costs patients, families, and the state.
Key Findings
Colorado’s overall breast cancer rates are near the national average, but its cancer outcomes are among the most favorable in the country.
- Colorado records 134.8 new invasive breast cancer cases and 18.8 deaths per 100,000 women, against 133 and 19 nationally.
- For women diagnosed from 2016 to 2022, Colorado’s five-year relative survival rate for female breast cancer was 93.7%, eighth highest among reporting states.
Colorado is tied for the lowest breast cancer mortality rate in the nation for women under 50.
- Colorado’s rate is 2.6 deaths per 100,000 women under 50, tied for the lowest in the nation with Vermont, and it fell 2.4% per year from 2020 to 2024. The state’s rate for women under 65 is 7 deaths per 100,000, third lowest in the nation.
- For women 65 and older however, Colorado’s rate of 100.2 is 11% above the national rate of 90.2 and showed no statistically significant decline from 2020 to 2024, while the national rate fell 0.7% per year.
Colorado’s breast cancer mortality rate has fallen 27% since 1999, sparing an estimated 3,400 lives, but progress has slowed.
- The rate dropped from 24.8 to 18 deaths per 100,000 women between 1999 and 2024. Had it stayed at its 1999 level, about 3,400 more Colorado women would have died of breast cancer from 2000 through 2024. Since 2008, the rate has declined 0.4% per year, one-third the national pace of 1.2%, and recent progress has been slower among women 65 and older.
Diagnoses are rising, and 5,210 Colorado women are projected to be diagnosed in 2026.
- The age-adjusted incidence rate increased about 0.7% per year from the mid-2000s through 2023 in Colorado and nationally, and faster among women under 50. As the number of Colorado women 65 and older is projected to grow nearly 30% by 2035, CSI projects about 5,500 to 6,100 diagnoses a year.
Places with higher mammography rates generally have lower breast cancer mortality rates.
- In a CSI analysis of U.S. counties, the fifth with the highest mammography rates had a breast cancer mortality rate about 13% lower than the fifth with the lowest, and a smaller share of cancers diagnosed at a late stage. Within Colorado, CDC estimates place 58 of 64 counties below the median U.S. county screening rate.
CSI estimates total spending on breast cancer care in Colorado at roughly $560 million a year, including about $62 million paid out of pocket by patients.
- In a 2022 study of insured patients, two-year health care costs averaged about $136,800 for those diagnosed at stage I, $267,500 at stage III and $501,200 at stage IV, in today’s dollars.
Breast Cancer Rates in Colorado
Colorado’s breast cancer incidence and overall mortality are both near the national average. From 2019 to 2023, Colorado recorded 134.8 new invasive breast cancer cases per 100,000 women, slightly above the U.S. rate of 133 and 23rd highest among the states. From 2020 to 2024, Colorado’s mortality rate of 18.8 per 100,000 women sat just below the national average of 19, and 21st lowest.[ii] That overall rate masks a sharp difference by age. Colorado’s rate for women under 65, 7 deaths per 100,000, is the third lowest in the nation, and its rate for women under 50, 2.6, is the lowest. For women 65 and older, Colorado’s rate of 100.2 per 100,000 is 11% above the national rate of 90.2 and among the 10 highest in the nation.
Because women 65 and older account for about 70% of Colorado’s breast cancer deaths, their higher rate pulls the state’s overall rate up to the national average.[iii] Colorado recorded 22,699 diagnoses during 2019–2023 and 3,301 deaths during 2020–2024, averaging about 4,500 diagnoses and 660 deaths annually over their respective periods.
Rates vary widely across the country. Delaware (148.1), Connecticut (147.4), and North Carolina (144.6) record the highest incidence.
Interestingly, the mountain west region has the three lowest rate states, although no clear reason can be attributed for this: Nevada (112.2), New Mexico (118.2), and Arizona (118.8). Massachusetts (15.2), Rhode Island (15.5), and Hawaii (16.1) post the lowest mortality rates; Mississippi (23.6), Oklahoma (22.3), and Delaware (22) have the highest.
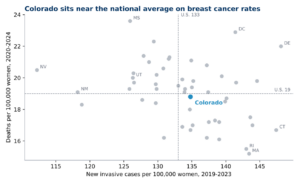
Figure 1. Female breast cancer incidence (2019-2023) and mortality (2020-2024) by state, age-adjusted rates per 100,000 women. Source: CDC/NCI U.S. Cancer Statistics, June 2026.
Colorado women compare favorably on several breast cancer risk factors, though these measures capture only part of breast cancer risk. In 2024, Colorado women had the lowest obesity rate in the nation, 26.2% against 34.4% nationally, and the second lowest rate of physical inactivity among the states, 16.9% against 24.2%. Among the risk factors examined here, Colorado compares less favorably on alcohol: in 2024, 14.4% of Colorado women reported binge drinking, above the national rate of 12.7%.[iv] The American Cancer Society attributes 16% of U.S. breast cancers to alcohol consumption.[v] Screening also shapes the numbers: states that find cancer earlier record higher incidence, a pattern discussed later in this report.
Breast Cancer Rates Over Time
The age-adjusted breast cancer mortality rate has fallen substantially. Nationally, the breast cancer mortality rate declined 44% from 1989 through 2023, averting an estimated 546,000 deaths.[vi] In Colorado, the mortality rate fell 27% between 1999 and 2024, from 24.8 to 18 deaths per 100,000 women.[vii] Had Colorado’s rate remained at its 1999 level, CSI estimates that about 3,400 more Colorado women would have died of breast cancer from 2000 through 2024, including about 240 in 2024 alone. The pace of that progress has changed. A CSI joinpoint analysis of CDC data identifies a turning point in 2008. Colorado’s mortality rate fell 2.4% per year from 1999 to 2008, then 0.4% per year from 2008 to 2024. The U.S. rate has fallen 1.2% per year since its own turning point in 2010, three times Colorado’s recent pace, and the difference between the two recent trends is statistically significant. As a result, Colorado’s mortality-rate advantage over the nation narrowed from 4.4 deaths per 100,000 women in 2007 to 0.7 in 2024. Had Colorado’s rate declined at the national pace since 2008, its 2024 trend rate would have been about 12% lower, or roughly 80 fewer deaths that year if the reduction applied evenly across age groups.
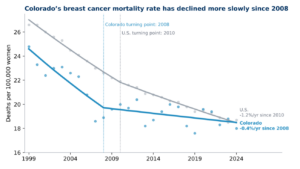
Figure 2. Female breast cancer mortality rates, Colorado and U.S., 1999-2024, age-adjusted per 100,000 women. Dots show annual rates; lines show the joinpoint trend fit. Source: CSI analysis of CDC/NCI U.S. Cancer Statistics, June 2026 release.
This analysis does not establish why Colorado’s progress has slowed, but several patterns warrant further study. Recent progress has been slower among women 65 and older. From 2020 to 2024, their mortality rate in Colorado showed no statistically significant decline, while the national rate fell 0.7% per year. For women under 65, Colorado’s rate fell 2.2% per year, faster than the national 1.8%, and for women under 50 it fell 2.4% per year.iii Colorado’s early gains were large: its mortality rate fell faster from 1999 to 2008 than all but five states, after Colorado’s mammography screening rate far exceeded the national rate in the early 1990s (70.9% vs. 62% among women 50 and older in 1992).[viii]
The slowdown also appears regional. Mountain West states as a group have seen mortality rates decline 0.6% per year since 2008, against 1.7% in the Northeast, and several of Colorado’s neighbors have slowed as much or more. Colorado’s early screening advantage has also disappeared: in 2024, 77.9% of Colorado women ages 50 to 74 had a recent mammogram, below the national rate of 79%, and across states, those with higher mammography rates today have seen faster declines since 2008. Overall incidence has risen at a similar pace in Colorado and the nation, although differences in age, cancer subtype, stage at diagnosis, or treatment could still play a role.
Diagnoses are moving in the other direction. Colorado’s breast cancer incidence rate has increased about 0.7% per year since the mid-2000s (2004 in Colorado and 2005 nationally), the same pace as the nation. Nationally, the increase is steeper among younger women: from 2013 to 2022, incidence among women under 50 rose 1.4% per year, against 0.7% for women 50 and older.[ix] Colorado shows the same pattern: from 2019 to 2023, incidence among Colorado women under 50 rose 1% per year, while the trend among women 50 and older was not statistically significant.[x] About one in five Colorado breast cancer diagnoses from 1999 to 2022 occurred in women under 50.[xi] The American Cancer Society identifies excess body weight, having fewer children, and having a first child after age 30 as possible contributors to the national rise among younger women. These are population-level associations and do not explain why any individual develops breast cancer.[xii]
2026 Estimates
The American Cancer Society projects 5,210 new female breast cancer cases and 710 breast cancer deaths in Colorado in 2026.[xiii] Breast cancer is projected to account for 17% of the state’s 30,160 new cancer cases and 8% of its 8,740 cancer deaths.
The 2026 projections exceed the highest annual counts observed in CDC data dating to 1999: 4,695 diagnoses and 684 deaths, both recorded in 2023. Since 1999, observed annual diagnoses have risen 64% through 2023 and deaths 34% through 2024.[xiv] Population growth and aging contribute to rising case counts, while the age-adjusted incidence rate has also increased. The American Cancer Society cautions that its projections are model-based and not suited to tracking trends, so the observed rates remain the best measure of progress.[xv] Colorado’s 2024 breast cancer mortality rate of 18 per 100,000 women was the second lowest on record, behind only 2019 (17.6).
Figure 3. Annual breast cancer diagnoses and deaths among Colorado women, 1999-2023. Diagnoses are new invasive cases and exclude stage zero; deaths are those with breast cancer as the underlying cause. Counts rise with population growth and aging as well as with changes in risk, so they increase faster than the age-adjusted rates discussed in this report.
If current trends hold, CSI projects Colorado’s 2026 breast cancer mortality rate at about 18.3 per 100,000 women, among the lowest on record and roughly 25% below 1999. The projection extends the joinpoint trend described above; Colorado’s annual rate typically varies by about one death per 100,000 women around that trend.
Colorado’s aging population will push case counts higher even if rates hold steady. The State Demography Office projects that the number of Colorado women 65 and older will grow 29% between 2023 and 2035, to about 662,000.[xvi] Applying current age-specific rates, CSI projects about 5,500 breast cancer diagnoses and 820 deaths a year in Colorado by 2035. If incidence keeps rising 0.7% per year and mortality keeps falling 0.4% per year, the 2035 totals would be about 6,100 diagnoses and 780 deaths. At today’s first-year cost per patient, care for women diagnosed in 2035 would cost at least $231 million in today’s dollars.
Nationally, the American Cancer Society projects 321,910 new invasive breast cancer cases among women, 60,730 cases of stage zero breast cancer and 42,140 deaths in 2026. About one in eight U.S. women will be diagnosed with breast cancer in her lifetime, and more than 4 million breast cancer survivors live in the United States.[xvii]
Stage Zero Breast Cancer
Stage zero breast cancer, known as ductal carcinoma in situ (DCIS), is a growth of abnormal cells confined to the milk ducts that has not invaded surrounding breast tissue. Almost all cases are found through screening mammography.[xviii] About one in six breast cancer diagnoses nationally is stage zero: the American Cancer Society projects 60,730 stage zero cases in 2026 on top of 321,910 invasive cases, or 60,730 of 382,640 in total. Stage zero is not counted in the invasive incidence rates reported above.[xix] A 2015 study of women who received care after a DCIS diagnosis found that about 3% died from breast cancer within 20 years.[xx]
Rising diagnoses are not only stage zero or early-stage cancers, however. National SEER data shows the rate of breast cancers first diagnosed after spreading to distant organs rose 33% between 2004 and 2023, from 6.4 to 8.5 per 100,000 women.[xxi] Advanced disease is not necessarily the result of missed screening: some cancers are not detected by a screening mammogram or develop between regular screenings, and some cancers first treated at an early stage return later.[xxii] Improving access to screening, timely diagnosis and effective treatment all offer opportunities for further progress.
Colorado’s Cancer Care
Colorado’s breast cancer survival is among the highest in the nation. Among women diagnosed from 2016 to 2022, Colorado’s five-year relative survival rate for female breast cancer was 93.7%, eighth highest among the 39 states with reported data and above the U.S. rate of 91.8%. Relative survival compares survival after a cancer diagnosis with expected survival among similar people in the general population. In Colorado, 5.5% of cases are first diagnosed after the cancer has spread to distant parts of the body, compared with 6% nationally.[xxiii] Colorado’s broader cancer outcomes are also comparatively favorable: its mortality rate for all cancers combined, 122.4 per 100,000, is the fifth lowest in the nation, behind only Hawaii, Utah, New York, and New Jersey.
Colorado also compares well within the region. Its breast cancer survival rate is higher than those of Utah and Arizona, the two neighboring states with reported survival data. The University of Colorado Anschutz Cancer Center is Colorado’s only National Cancer Institute-designated Comprehensive Cancer Center and one of only four in the 10-state Rocky Mountain region.[xxiv]
| Colorado Has Higher Breast Cancer Survival Than Neighbors With Reported Data | |||||
| State | Incidence, 2019-23 | Mortality, 2020-24 | 5-yr relative survival, diagnosed 2016-22 | Mammogram, 50-74 (2024) | All-cancer mortality, 2024 |
| Colorado | 134.8 | 18.8 | 93.7% | 77.9% | 122.4 |
| Utah | 126.3 | 20.0 | 91.4% | 74.2% | 117.7 |
| Arizona | 118.8 | 18.3 | 91.3% | 76.4% | 126.8 |
| New Mexico | 118.2 | 19.1 | No Data | 75.6% | 125.6 |
| Wyoming | 126.5 | 19.7 | No Data | 69.1% | 136.1 |
| Nebraska | 129.7 | 19.6 | No Data | 78.0% | 143.4 |
| Kansas | 135.0 | 19.4 | No Data | 76.9% | 150.8 |
| United States | 133.0 | 19.0 | 91.8% | 79.0% | 139.2 |
Table 1. Source: CDC/NCI U.S. Cancer Statistics, June 2026 release; CDC Behavioral Risk Factor Surveillance System, 2024. Incidence and mortality are age-adjusted rates per 100,000 women; all-cancer mortality is per 100,000 people. Survival is five-year relative survival. No Data: state not included in CDC survival estimates.
Stage at diagnosis strongly shapes survival. Among U.S. women, five-year relative survival is above 99% when breast cancer is found at the localized stage, 87% at the regional stage, and 33% once it has spread to distant organs.[xxv]
The ten states with the highest screening rates average 17.4 breast cancer deaths per 100,000 women, compared with 19.2 in the ten states with the lowest screening rates, despite approximately 10% higher incidence rates (142.6 against 129.9 per 100,000).[xxvi]
The same pattern appears at the county level. In a CSI analysis of U.S. counties, the fifth with the highest mammography rates had a breast cancer mortality rate of 18.5 per 100,000, about 13% below the 21.2 in the lowest-screening fifth, and 29.5% of their cancers were diagnosed at a late stage, against 32.7%. Both patterns hold when comparing counties within the same state, and Colorado’s counties follow the same late-stage pattern.[xxvii]
These comparisons show associations, not cause and effect: they compare screening rates with cancer outcomes from overlapping years and do not account for differences in treatment access, tumor characteristics, or population. Clinical research has separately found that breast cancer screening reduces deaths from the disease.[xxviii] A higher recorded case rate can partly reflect a health system that finds more cancers.
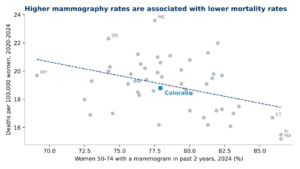
Figure 4. Mammography screening (women 50-74, 2024) and breast cancer mortality rates (2020-2024) by state. Dashed line shows the linear trend. The relationship is an association and does not establish cause. Source: CSI analysis of CDC/NCI U.S. Cancer Statistics, June 2026 release.
Statewide, 77.9% of Colorado women ages 50 to 74 had a mammogram within two years in 2024, close to the national rate of 79% and tied for 25th among the states.[xxix] The 50-to-74 age range reflects the survey measure; the U.S. Preventive Services Task Force now recommends a mammogram every other year for average-risk women ages 40 to 74.[xxx]
The local picture in Colorado is uneven. CDC model estimates place 58 of Colorado’s 64 counties below the median U.S. county screening rate of 73.6%. The lowest rates are in Kiowa (62.3%), Bent and Otero (63.9%), Baca (64.2%), Crowley (64.6%), and Adams (64.9%) counties. Douglas County is highest at 77.2%.[xxxi] County figures are 2022 CDC model-based estimates with wide margins of error and are not directly comparable with the statewide 2024 survey rate.
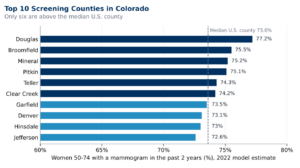
Figure 5. County figures are CDC model-based estimates with wide margins of error. See Appendix Table A1 for all 64 counties. Source: CDC PLACES, 2025 release.
Colorado’s highest-screening counties provide a benchmark for improving screening statewide. Expanded coverage for qualifying breast exams in state-regulated health plans and assistance through the Women’s Wellness Connection may help more women receive timely screening. Coverage exceptions, travel, and time away from work can still limit access.
Economic and Workforce Impact
Breast cancer carries a heavy economic cost for patients, families, employers, and taxpayers. Breast cancer accounted for the largest estimated national spending on cancer care in 2020: an estimated $29.8 billion, about $34.6 billion in today’s dollars.[xxxii] Including prescription drugs, the additional cost of care attributable to cancer averages about $42,000 per patient in the first year after diagnosis, about $5,100 a year during continuing care, and about $91,500 in the final year of life, based on older Medicare claims adjusted to today’s dollars.[xxxiii]
Medical costs are also higher when breast cancer is diagnosed at a later stage. Among commercially insured and Medicare Advantage patients diagnosed from 2016 to 2020, average health care costs over the first two years after diagnosis were about $136,800 for stage I and $215,400 for stage II, against $267,500 for stage III and $501,200 for stage IV, in today’s dollars.[xxxiv] Two-year costs for patients diagnosed at stage IV ran about $364,000 higher than for those diagnosed at stage I. These figures compare costs by stage at diagnosis; they do not measure savings caused by screening.
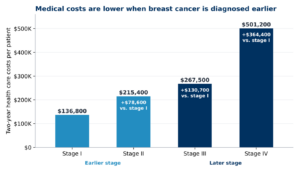
Figure 6. Average two-year health care costs per patient by stage at diagnosis, commercially insured and Medicare Advantage patients diagnosed 2016-2020, August 2026 dollars. Costs sum the study’s mean costs for the first and second years after diagnosis and include all health care, not only cancer treatment. Differences are shown relative to stage I. Source: CSI analysis of McGarvey et al. (2022).
Applying the older Medicare-based estimate of approximately $42,000 in first-year cancer-related costs to Colorado’s projected 5,210 diagnoses produces a rough estimate of $219 million, spending that will extend into 2027. Allocating national spending by Colorado’s share of new diagnoses, CSI estimates total breast cancer care in the state at roughly $560 million a year; this rough allocation assumes Colorado’s share of new cases also reflects its share of spending on women already living with the disease. Patients carry part of that cost directly. Breast cancer patients nationally paid $3.14 billion out of pocket in 2019, more than for any other cancer; that is about $3.8 billion in today’s dollars, roughly $62 million a year allocated to Colorado.[xxxv]
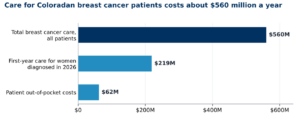
Figure 7. Estimated annual cost of breast cancer in Colorado, August 2026 dollars. Total care and out-of-pocket costs are rough allocations of national estimates by Colorado’s share of new diagnoses. First-year care covers women diagnosed in 2026 and extends into 2027. These estimates overlap and should not be added. Source: CSI estimates based on NCI, Yabroff et al. (2021).
Medical bills and time away from work put patients and families under financial strain. A national study covering 2005 to 2019 found that 31.8% of women under 65 receiving breast cancer care lived in families that spent more than 10% of family income on out-of-pocket health costs, including insurance premiums. Among women at or below 138% of the federal poverty level, that share rose to 50.4%.[xxxvi]
The disease reaches well beyond the patient. The National Alliance for Caregiving and AARP’s 2015 Caregiving in the U.S. survey, a national survey of unpaid family caregivers, found that half of those caring for someone with cancer were also holding a job. These working cancer caregivers spent an average of 23.4 hours a week on care, more than half of a full-time workweek. Nearly half (48%) had to adjust their work schedules to provide care; about one in four (24%) had cut back their hours; and about one in nine (11%) had quit or retired early.[xxxvii] These figures cover caregivers for all cancer types.
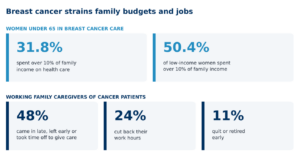
Figure 8. Financial and work effects for women in breast cancer care and for family caregivers. Patient figures cover U.S. women under 65 receiving breast cancer care, Medical Expenditure Panel Survey, 2005-2019; health spending is family out-of-pocket spending, including premiums, relative to family income; low income is at or below 138% of the federal poverty level. Caregiver figures cover employed caregivers for all cancers, NAC/AARP 2015 Caregiving in the U.S. survey. Sources: Berlin et al. (2024); Longacre et al. (2021).
When someone dies of breast cancer, the loss reaches across their family and community, and lost earnings capture only one part of that impact. A national study estimated that women ages 16 to 84 who died of breast cancer in 2015 would have gone on to earn $6.15 billion over their lifetimes, about $9.3 billion in today’s dollars. Allocating that total by Colorado’s share of projected 2026 breast cancer deaths, CSI estimates Colorado’s share at roughly $156 million. By the same measure, the roughly 3,400 Colorado deaths averted since 1999 preserved about $760 million in lifetime earnings.[xxxviii]
Medicaid helps people with low incomes obtain screening and treatment, and maintaining coverage during treatment is especially important for patients and families. Nationally, 16.9% of newly diagnosed cancer patients ages 18 to 64 were covered by Medicaid in 2019, rising to 19.9% in states that expanded Medicaid, including Colorado.[xxxix] Colorado’s Medicaid Breast and Cervical Cancer Treatment Program, which covers treatment for low-income women diagnosed through state screening programs, had approximately 200 people enrolled during 2024.[xl] Yet according to 2022 claims data, just 45% of urban and 42% of rural Colorado women ages 50 to 74 covered by Medicaid were up to date on mammograms, compared with 64% of women statewide across all insurers.[xli] CSI estimates that raising screening among the roughly 100,000 Colorado women ages 50 to 74 covered by Medicaid to the statewide rate would bring about 19,000 more women up to date and add about 9,500 mammograms a year, at a cost of roughly $2.3 million.[xlii] Barriers to screening and timely follow-up may contribute to later diagnoses and higher costs for patients and public programs.
As the General Assembly’s new Commission on Medicaid looks for ways to slow cost growth ahead of its December 11, 2026, report, earlier diagnosis is one area where better health outcomes and lower medical costs can align.
Bottom Line
Colorado reports some of the most favorable cancer outcomes in the country, and its breast cancer survival rate exceeds the U.S. rate. Falling mortality rates since 1999 have spared an estimated 3,400 Colorado women, and Colorado women under 65 have one of the lowest breast cancer mortality rates in the nation. Colorado women have lower rates of obesity and physical inactivity than the national average, and the state is home to one of only four National Cancer Institute-designated Comprehensive Cancer Centers in the 10-state Rocky Mountain region, the University of Colorado Anschutz Cancer Center.
Colorado’s breast cancer survival exceeds the national rate, but diagnoses are rising and mortality improvements have slowed. The state’s aging population and screening gaps, particularly among Medicaid members and in low-screening counties, warrant attention. Earlier detection and continued advances in treatment can help Colorado build on its strong survival outcomes.
Methodology
Joinpoint Model:
CSI fit log-linear joinpoint regressions to annual age-adjusted rates, weighting each year by the inverse of its variance on the log scale (the squared rate divided by its squared standard error), and selected the number of turning points using sequential permutation tests (999 permutations, up to three turning points, Bonferroni-adjusted), following the National Cancer Institute’s Joinpoint method.[xliii] One turning point was selected for each series. Because Colorado and the U.S. have different turning points (2008 and 2010), CSI compared their slopes over 2015-2024, a period inside each series’ final segment, using a two-sided z-test (z = 4.3, p < 0.001); the test treats the two series as independent, although Colorado is part of the U.S. total. The counterfactual 2024 rate applies the U.S. annual percent change to Colorado’s fitted 2008 rate; the estimate of about 80 fewer deaths assumes the lower rate applied proportionally across age groups. The 2020 incidence rate was excluded from the fit because of COVID-19 disruptions to diagnosis.
State Trend Comparisons:
Cross-state trend comparisons use annual percent changes from log-linear fits to each state’s annual age-adjusted female breast cancer mortality rates, 1999-2008 and 2008-2024. Regional figures are simple averages of state trends (Mountain West: Arizona, Colorado, Idaho, Montana, Nevada, New Mexico, Utah, Wyoming; Northeast: Connecticut, Maine, Massachusetts, New Hampshire, New Jersey, New York, Pennsylvania, Rhode Island, Vermont). The correlation between 2024 state mammography rates and 2008-2024 mortality-rate trends across 49 states is r = -0.42 (p = 0.002), an association that does not establish cause.
Age-Specific Data:
Age-specific incidence and mortality rates come from the National Cancer Institute’s State Cancer Profiles, which report five-year average rates (2019-2023 for incidence, 2020-2024 for mortality) for women under 50, under 65, 50 and older, and 65 and older, and five-year trends estimated by NCI. These trends are calculated separately from CSI’s joinpoint analysis of statewide rates.
Deaths Averted:
CSI estimated deaths averted by applying Colorado’s 1999 age-adjusted breast cancer mortality rate, as fitted by the joinpoint model (24.6 per 100,000), to each year’s observed deaths: expected deaths equal observed deaths multiplied by the ratio of the 1999 rate to that year’s rate. Summed over 2000-2024, the difference between expected and observed deaths is about 3,400; using the observed 1999 rate (24.8) gives about 3,550, and using the 1999-2001 average (23.5) gives about 2,600. Lifetime earnings preserved apply the national lost earnings per 2015 breast cancer death, about $224,000 in August 2026 wage-adjusted dollars, to the deaths averted.
County Screening Analysis:
CSI matched CDC PLACES 2022 model-based, age-adjusted estimates of mammography use among women 50 to 74 with NCI State Cancer Profiles county data on female breast cancer incidence and late-stage incidence (2019-2023) and mortality (2020-2024), excluding counties with suppressed data (2,310 counties for late-stage share and 1,807 for mortality). Counties were grouped into fifths by screening rate, and averages were weighted by case or death counts. Within-state comparisons subtract each state’s weighted average. High-screening counties recorded higher incidence and a lower share of late-stage cancers, but similar late-stage incidence per resident, consistent with screening finding more cancers early. The analysis is ecological and does not establish cause.
Medicaid Screening Estimate:
The number of Colorado women ages 50 to 74 with Medicaid or other means-tested coverage, about 100,000, comes from the 2024 American Community Survey, counting half of women 45 to 54. Closing the gap between the Medicaid screening rate (45%) and the statewide rate (64%) adds about 19,000 women screened every two years. Costs use 2026 Medicare national rates for screening mammography with tomosynthesis ($179) as a proxy for Medicaid payment, plus diagnostic follow-up for the 11.6% of screens that are recalled.[xliv][xlv] The estimate covers screening and follow-up costs only. CSI did not estimate treatment savings or deaths averted, because the county analysis does not show that higher screening reduces late-stage cancers per resident.
2035 Projections:
CSI divided Colorado’s 2019-2023 diagnoses and 2020-2024 deaths for women under 50, 50 to 64, and 65 and older by State Demography Office population estimates for the same years, then applied those rates to the Office’s female population forecasts for 2026, 2030 and 2035. Trend scenarios apply the joinpoint incidence (+0.7% per year) and mortality (-0.4% per year) trends.
Cost and Earnings Estimates:
Stage-specific costs come from McGarvey et al. (2022), which reports standardized cost estimates for all health care, not only cancer treatment. The study built annual costs from monthly averages among patients still enrolled and alive in each month, so the two-year totals are not the average bills of a fixed group of patients. National Cancer Institute per-patient figures estimate additional costs attributable to cancer, compared with similar people without cancer, and so measure something different from the all-health-care stage costs. Colorado’s lost earnings allocate the national estimate for 2015 deaths at ages 16 to 84, adjusted to August 2026 with average hourly earnings, by Colorado’s share of projected 2026 U.S. female breast cancer deaths (1.7%).
Appendix
Mammography screening by Colorado county
Women ages 50-74 with a mammogram in the past two years, 2022 age-adjusted model estimates. Median U.S. county: 73.6%.
| Rank | County | Rate | Rank | County | Rate | |
| 1 | Douglas | 77.2% | 33 | Grand | 69% | |
| 2 | Broomfield | 75.5% | 34 | Huerfano | 69% | |
| 3 | Mineral | 75.2% | 35 | Jackson | 68.6% | |
| 4 | Pitkin | 75.1% | 36 | Rio Blanco | 68.4% | |
| 5 | Teller | 74.3% | 37 | Larimer | 68.3% | |
| 6 | Clear Creek | 74.2% | 38 | Saguache | 68.3% | |
| 7 | Garfield | 73.5% | 39 | Chaffee | 68.2% | |
| 8 | Denver | 73.1% | 40 | Las Animas | 68.2% | |
| 9 | Hinsdale | 73% | 41 | Alamosa | 68.1% | |
| 10 | Jefferson | 72.6% | 42 | Logan | 68.1% | |
| 11 | Weld | 72.5% | 43 | Pueblo | 68.1% | |
| 12 | Arapahoe | 72.4% | 44 | Dolores | 68% | |
| 13 | Boulder | 72.1% | 45 | Phillips | 68% | |
| 14 | Park | 72% | 46 | Morgan | 67.6% | |
| 15 | Routt | 72% | 47 | Archuleta | 67.5% | |
| 16 | San Miguel | 71.6% | 48 | Kit Carson | 67.4% | |
| 17 | Rio Grande | 71.5% | 49 | Lincoln | 67.4% | |
| 18 | La Plata | 71.3% | 50 | Conejos | 66.8% | |
| 19 | Montrose | 71.3% | 51 | Yuma | 66.7% | |
| 20 | Ouray | 71.2% | 52 | Mesa | 66.6% | |
| 21 | Elbert | 71% | 53 | Sedgwick | 66.5% | |
| 22 | Summit | 71% | 54 | Moffat | 66.3% | |
| 23 | Lake | 70.9% | 55 | Montezuma | 66.2% | |
| 24 | Cheyenne | 70.7% | 56 | Costilla | 65.6% | |
| 25 | Eagle | 70.4% | 57 | Delta | 65.5% | |
| 26 | Custer | 70.1% | 58 | Prowers | 65.3% | |
| 27 | El Paso | 70% | 59 | Adams | 64.9% | |
| 28 | Gilpin | 70% | 60 | Crowley | 64.6% | |
| 29 | San Juan | 69.7% | 61 | Baca | 64.2% | |
| 30 | Washington | 69.6% | 62 | Bent | 63.9% | |
| 31 | Gunnison | 69.5% | 63 | Otero | 63.9% | |
| 32 | Fremont | 69.1% | 64 | Kiowa | 62.3% |
Shaded rows: at or above the median U.S. county. County figures are CDC model-based estimates with wide margins of error and are not directly comparable with the statewide 2024 survey rate. Source: CDC PLACES: Local Data for Better Health, County Data, 2025 release.
[i] U.S. Cancer Statistics Working Group. U.S. Cancer Statistics Data Visualizations Tool: limited-duration prevalence of invasive female breast cancer diagnosed since 2001, Colorado. Centers for Disease Control and Prevention and National Cancer Institute, released June 2026. https://gis.cdc.gov/Cancer/USCS/
[ii] U.S. Cancer Statistics Working Group. U.S. Cancer Statistics Data Visualizations Tool. Centers for Disease Control and Prevention and National Cancer Institute, released June 2026. https://www.cdc.gov/cancer/dataviz
[iii] National Cancer Institute, State Cancer Profiles, Death Rates Table: Breast (Female), Ages <50, <65, 50+ and 65+, 2020-2024, accessed October 2026. https://statecancerprofiles.cancer.gov/deathrates/index.php?stateFIPS=00&areatype=state&cancer=055&race=00&sex=2&age=009&year=0&type=death&sortVariableName=rate&sortOrder=default
[iv] Centers for Disease Control and Prevention. Behavioral Risk Factor Surveillance System, 2024. Age-adjusted prevalence among women 18 and older (obesity, no leisure-time physical activity, binge drinking) and women 50-74 (mammography within two years), via U.S. Cancer Statistics Data Visualizations Tool, Screening and Risk Factors module, June 2026 release. https://gis.cdc.gov/Cancer/USCS/#/screening-and-risk-factors
[v] Islami F, Marlow EC, Thomson B, et al. Proportion and number of cancer cases and deaths attributable to potentially modifiable risk factors in the United States, 2019. CA: A Cancer Journal for Clinicians. 2024;74(5):405-432.
https://doi.org/10.3322/caac.21858
[vi] American Cancer Society. Cancer Facts & Figures 2026. Atlanta: American Cancer Society; 2026. https://www.cancer.org/research/cancer-facts-statistics/all-cancer-facts-figures/2026-cancer-facts-figures.html
[vii] U.S. Cancer Statistics Working Group. U.S. Cancer Statistics Data Visualizations Tool. Centers for Disease Control and Prevention and National Cancer Institute, released June 2026. https://gis.cdc.gov/Cancer/USCS/
[viii] Colorado Department of Public Health and Environment, Survey Research Unit. “Breast Cancer Screening Practices: Colorado Women Aged 50 and Older, 1995-1997.” Brief No. 26, October 26, 1998.
https://www.cohealthdata.dphe.state.co.us/chd/Resources/briefs/brstcan.pdf
[ix] American Cancer Society. Cancer Facts & Figures 2026. Atlanta: American Cancer Society; 2026. https://www.cancer.org/research/cancer-facts-statistics/all-cancer-facts-figures/2026-cancer-facts-figures.html
[x] National Cancer Institute, State Cancer Profiles, Incidence Rates Table: Breast (Female), Ages <50 and 50+, 2019-2023, accessed October 2026. https://statecancerprofiles.cancer.gov/incidencerates/index.php?stateFIPS=00&areatype=state&cancer=055&race=00&sex=2&age=009&stage=999&year=0&type=incd&sortVariableName=rate&sortOrder=default&output=0
[xi] Centers for Disease Control and Prevention. United States and Puerto Rico Cancer Statistics, 1999-2022 Incidence, CDC WONDER Online Database. Accessed October 2, 2026. https://wonder.cdc.gov/cancer.html
[xii] American Cancer Society. Key Statistics for Breast Cancer. https://www.cancer.org/cancer/types/breast-cancer/key-statistics.html
[xiii] American Cancer Society. Cancer Facts & Figures 2026. Atlanta: American Cancer Society; 2026. https://www.cancer.org/research/cancer-facts-statistics/all-cancer-facts-figures/2026-cancer-facts-figures.html
[xiv] U.S. Cancer Statistics Working Group. U.S. Cancer Statistics Data Visualizations Tool. Centers for Disease Control and Prevention and National Cancer Institute, released June 2026. https://gis.cdc.gov/Cancer/USCS/
[xv] American Cancer Society. Cancer Facts & Figures 2026, Sources of Statistics: projected cases and deaths are model-based and not suitable for tracking cancer trends. https://www.cancer.org/research/cancer-facts-statistics/all-cancer-facts-figures/2026-cancer-facts-figures.html
[xvi] Colorado State Demography Office. Single Year of Age by County: Population Estimates and Forecasts, female population, accessed October 2026. https://demography.dola.colorado.gov/
[xvii] American Cancer Society. Key Statistics for Breast Cancer. https://www.cancer.org/cancer/types/breast-cancer/key-statistics.html
[xviii] Susan G. Komen. Breast Cancer Statistics. Accessed October 2026. https://www.komen.org/breast-cancer/facts-statistics/breast-cancer-statistics/
[xix] American Cancer Society. Cancer Facts & Figures 2026. Atlanta: American Cancer Society; 2026. https://www.cancer.org/research/cancer-facts-statistics/all-cancer-facts-figures/2026-cancer-facts-figures.html
[xx] Narod SA, Iqbal J, Giannakeas V, Sopik V, Sun P. Breast cancer mortality after a diagnosis of ductal carcinoma in situ. JAMA Oncology. 2015;1(7):888-896. https://doi.org/10.1001/jamaoncol.2015.2510
[xxi] National Cancer Institute. SEER*Explorer: Breast cancer, recent trends in SEER incidence rates by stage at diagnosis, 2004-2023. SEER 21 registries, November 2025 submission. https://seer.cancer.gov/statistics-network/explorer/
[xxii] National Cancer Institute. Breast Cancer Screening (PDQ), Patient Version. https://www.cancer.gov/types/breast/patient/breast-screening-pdq
[xxiii] U.S. Cancer Statistics Working Group. U.S. Cancer Statistics Data Visualizations Tool. Centers for Disease Control and Prevention and National Cancer Institute, released June 2026. https://gis.cdc.gov/Cancer/USCS/
[xxiv] University of Colorado Anschutz Cancer Center. About Us. https://medschool.cuanschutz.edu/colorado-cancer-center/about-us
[xxv] American Cancer Society. Cancer Facts & Figures 2026. Atlanta: American Cancer Society; 2026. https://www.cancer.org/research/cancer-facts-statistics/all-cancer-facts-figures/2026-cancer-facts-figures.html
[xxvi] U.S. Cancer Statistics Working Group. U.S. Cancer Statistics Data Visualizations Tool. Centers for Disease Control and Prevention and National Cancer Institute, released June 2026. https://gis.cdc.gov/Cancer/USCS/
[xxvii] CSI analysis of Centers for Disease Control and Prevention, PLACES: Local Data for Better Health, County Data, 2025 release (mammography use, women 50-74, 2022), and National Cancer Institute, State Cancer Profiles, county female breast cancer incidence and late-stage incidence (2019-2023) and death rates (2020-2024), accessed October 2026. https://statecancerprofiles.cancer.gov/
[xxviii] National Cancer Institute. Breast Cancer Screening (PDQ), Patient Version. https://www.cancer.gov/types/breast/patient/breast-screening-pdq
[xxix] Centers for Disease Control and Prevention. Behavioral Risk Factor Surveillance System, 2024. Age-adjusted prevalence among women 18 and older (obesity, no leisure-time physical activity, binge drinking) and women 50-74 (mammography within two years), via U.S. Cancer Statistics Data Visualizations Tool, Screening and Risk Factors module, June 2026 release. https://gis.cdc.gov/Cancer/USCS/#/screening-and-risk-factors/obesity
[xxx] U.S. Preventive Services Task Force. Breast Cancer: Screening. Final Recommendation Statement, April 30, 2024. https://www.uspreventiveservicestaskforce.org/uspstf/recommendation/breast-cancer-screening
[xxxi] Centers for Disease Control and Prevention. PLACES: Local Data for Better Health, County Data, 2025 release. https://data.cdc.gov/500-Cities-Places/PLACES-Local-Data-for-Better-Health-County-Data-20/swc5-untb
[xxxii] U.S. Bureau of Labor Statistics, Consumer Price Index for All Urban Consumers: Medical Care Services (CUSR0000SAM2) and Average Hourly Earnings of All Employees, Total Private (CES0500000003), via Federal Reserve Bank of St. Louis FRED. Accessed October 2026.
[xxxiii] National Cancer Institute. Cancer Trends Progress Report: Financial Burden of Cancer Care. https://progressreport.cancer.gov/after/economic_burden
[xxxiv] McGarvey N, Gitlin M, Fadli E, et al. Increased healthcare costs by later stage cancer diagnosis. BMC Health Services Research. 2022;22:1155. https://doi.org/10.1186/s12913-022-08457-6. CSI calculation: two-year costs sum the study’s mean breast cancer costs for years 1 and 2 after diagnosis (Figure 2a, 2020 dollars), adjusted to August 2026 dollars using the Consumer Price Index for medical care services.
[xxxv] Yabroff KR, et al. Annual Report to the Nation on the Status of Cancer, Part 2: Patient economic burden associated with cancer care. Journal of the National Cancer Institute. 2021;113(12):1670-1682. https://doi.org/10.1093/jnci/djab192
[xxxvi] Berlin NL, Albright BB, Moss HA, Offodile AC II. Catastrophic health expenditures, insurance churn, and non-employment among women with breast cancer. JNCI Cancer Spectrum. 2024;8(2):pkae006. https://doi.org/10.1093/jncics/pkae006
[xxxvii] Longacre ML, Weber-Raley L, Kent EE. Cancer caregiving while employed: caregiving roles, employment adjustments, employer assistance, and preferences for support. Journal of Cancer Education. 2021;36(5):920-932. https://doi.org/10.1007/s13187-019-01674-4
[xxxviii] Islami F, Miller KD, Siegel RL, et al. National and state estimates of lost earnings from cancer deaths in the United States. JAMA Oncology. 2019;5(9):e191460. https://doi.org/10.1001/jamaoncol.2019.1460
[xxxix] Hu X, Yang NN, Fan Q, Yabroff KR, Han X. Health insurance coverage among incident cancer cases from population-based cancer registries in 49 US states, 2010-2019. Health Affairs Scholar. 2024;2(1):qxad083. https://doi.org/10.1093/haschl/qxad083
[xl] KFF. Medicaid Breast and Cervical Cancer Treatment Program Enrollment. https://www.kff.org/medicaid/state-indicator/medicaid-breast-and-cervical-cancer-treatment-program-enrollment/
[xli] Center for Improving Value in Health Care. Data Dive: Breast Cancer Screenings in Colorado. October 21, 2024. https://civhc.org/2024/10/21/data-dive-breast-cancer-screenings-in-colorado/
[xlii] U.S. Census Bureau. American Community Survey 2024 1-Year Estimates, Table B27007: Medicaid/Means-Tested Public Coverage by Sex by Age, Colorado. https://data.census.gov/table/ACSDT1Y2024.B27007?g=040XX00US08
[xliii] Kim HJ, Fay MP, Feuer EJ, Midthune DN. Permutation tests for joinpoint regression with applications to cancer rates. Statistics in Medicine. 2000;19(3):335-351. Erratum: 2001;20(4):655.
[xliv] Hologic. Mammography Coding Guide: 2026 Medicare National Average Rates (CPT 77067, 77063). https://www.hologic.com/sites/default/files/MISC-03286%20REV%20016%20Mammography%20Coding%20Guide%202026%20Rates%5B49%5D.pdf
[xlv] Lehman CD, Arao RF, Sprague BL, et al. National Performance Benchmarks for Modern Screening Digital Mammography: Update from the Breast Cancer Surveillance Consortium. Radiology. 2017;283(1):49-58. https://doi.org/10.1148/radiol.2016161174
RECENT/RELATED RESEARCH
Breast Cancer Awareness Month: Colorado Spotlight

Breast Cancer Awareness Month: Colorado Spotlight Introduction About one in eight American women, and roughly one in 755 men, will…
Nuclear Power and the Future of Energy in Colorado
Key Findings Colorado’s electricity demand is projected to more than double by 2050. State-contracted modeling projects annual demand of 120…
Ballot Issue 7A: Proposed Tax for Front Range Rail

Ballot Issue 7A: Proposed Tax for Front Range Rail Key Findings The proposed sales tax would reach many residents without…
Ballot Issue 2J: Boulder’s Proposed Residential Vacancy Tax

Ballot Issue 2J: Boulder’s Proposed Residential Vacancy Tax Introduction On November 3, 2026, City of Boulder voters will decide whether…