Interchange fees are charges paid by a merchant’s bank (acquirer) to the cardholder’s bank (issuer) each time a credit or debit card is used for a transaction, and are based on the type of card used, and the payment method for which the card was used (in person, online, or manually keyed in). While the acquiring bank is responsible for paying these fees, they are typically passed down to the merchant who ultimately bears the cost. Interchange fees are usually calculated as a percentage of the transaction amount, including taxes and any gratuity, but often includes a small, fixed amount per transaction. As a percentage of the average transaction, interchange fees averaged 0.73% and 1.80% for debit and credit card transactions, respectively.
Revenue from interchange fees is used by the issuing bank to fund various services, such as covering fraud prevention costs and the numerous rewards and cash-back programs offered through some debit and credit cards, both of which can impose significant costs to issuing banks.
In 2022, for instance, the six largest issuers of credit cards in the U.S. alone paid $67.9 billion in rewards – a 23.7% increase from the previous year – and reported billions more in liabilities for rewards not yet claimed by cardholders. Fraud losses for that year reached billions for issuers as well, with losses expected to exceed $165 billion over the next ten years. Beyond the losses themselves, financial institutions expend countless resources preventing fraud in the first place, and investigating it when it does occur. Lexis Nexis reported in its seventh annual True Cost of Fraud Study that each for each dollar lost to fraud, financial institutions in the U.S. and Canada lose $4.41.
Interchange fees also serve as compensation for issuing banks for assuming the risks associated with debit and credit card transactions, such as when a cardholder has insufficient funds in their account to pay for a transaction, or when issuers need to write off outstanding balances they can no longer recover (also called bad debt).
In the case of debit cards, transactions can sometimes pass the clearing process despite not having sufficient funds later during settlement. With credit cards, cardholders use issuer funds to make purchases with the promise to repay at a later date, and in many instances, fail to pay back those liabilities in a timely fashion, if at all. For instance, the New York Federal Reserve notes that as of Q3 of 2024, 3.23% of all credit card debt was delinquent with banks writing off another 4.69% as uncollectable, with both rates reaching their highest levels since 2011. In both cases card issuers assume the risk associated with the transaction.
A common misconception is that payment networks like Visa and Master Card receive revenues from interchange fees. Although payment networks such as Visa and Master Card set the level of interchange fees, they are paid by acquiring banks, who pass down those costs to their merchant customers.
Networks must balance the level of interchange fees between the interests of acquiring banks (and merchants) and card issuers. If interchange fees are set too high, acquiring banks – and their merchant customers – will not accept that network’s cards as a form of payment. Set rates too low and issuing banks will not issue a network’s card.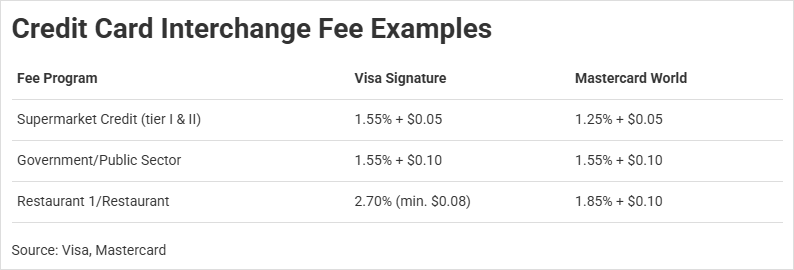
How Card Payments Work
When a consumer uses their debit or credit card to make a purchase, the merchant’s payment gateway or payment processor – often in the form of a point-of-sale (POS) device – collects essential information such as the debit or credit card number, expiration date, Card Verification Value (CVV), and the transaction amount. Business-to-consumer transactions utilize level 1 data, which is limited in scope and the information that is transmitted, and most importantly, does not transmit tax data.
Card and purchase information is then securely transmitted in encrypted form to the merchant’s bank (acquirer) or, in many cases, a third-party payment processor. The acquiring bank or processor forwards the transaction details to the relevant card network (e.g., Visa, MasterCard), which in turn sends the request to the issuing bank or their third-party processor. Upon receiving the request, the issuing bank verifies the card details, checks the availability of funds, ensures the card’s validity, and performs fraud prevention checks. After reviewing these elements, the issuing bank either approves or denies the transaction. The payment gateway or processor then promptly notifies the merchant of the decision, allowing the transaction to proceed, all of which happens within milliseconds.
Who Pays What?
The payment card system is designed to securely handle sensitive information, facilitate data exchange between parties, and reduce the risk of fraud. To support this system, fees are applied whenever a credit or debit card is used in a transaction, which funds the various entities and components that make the system function. These typically include gateway fees, acquirer fees, network fees, and interchange fees.
Card Acquirer: The card acquirer – or merchant's bank – is responsible for the payment of network and interchange fees. However, these costs are typically transferred to the merchant in the form of a Merchant Service Charge (MSC) or Merchant Discount Rate (MDR), which is often subject to negotiation between the acquirer and the merchant. In addition to network and interchange fees, acquirers may also charge merchants additional acquirer fees for their services.
Merchant: Merchants bear the cost of the MSC or MDR, which covers both the network and interchange fees, as well as the acquirer fees. Merchants are also liable for gateway fees or merchant service provider (MSP) fees.
Card Issuer: Card issuers, typically banks or other financial institutions, are responsible for paying network fees and providing rewards or cashback incentives to cardholders. In return, card issuers receive interchange fees from merchants and may also collect fees from cardholders, such as annual fees or late payment charges. Many issuers also pay a third-party to process their card payments.
Cardholder: Cardholders are responsible for interest and other account fees associated with their debit or credit card.
The Economics of Card Payments
The payment card industry serves as a prime example of a two-sided market. These markets are characterized by interactions between two distinct groups of agents facilitated by a third-party intermediary, where the decisions or participation of one group influences the participation of the other. In the case of the payment card industry, consumers and merchants represent the two agents, while payment card networks act as the intermediaries. For payment cards to succeed, consumers must be willing to use them, and merchants must be willing to accept them. In other words, the participation of either party in the market directly impacts the participation of the other party, as customers cannot use a card that no merchant is willing to accept, and vice-versa.
This arrangement can lead to outcomes much different than those experienced in more traditional, one-sided markets. In particular, two-sided markets often lead to one side subsidizing the other, especially if one side happens to be more price sensitive. With the payment card industry, merchants and acquiring banks subsidize card usage by consumers, but this is not unique to the payment card industry. Social media platforms are free for users, but the revenues that support these platforms comes from advertisers. In this instance, advertisers subsidize the users of social media.
Rising Merchant Costs
Much of the attention over the fees associated with the card payment system has been focused on those borne by merchants. According to a 2024 CMSPI report, merchants in the U.S. paid over $224 billion in total fees in 2023, with $143 billion alone going to interchange. About 74% of total interchange fee revenue comes from credit cards versus about 26% for debit cards.
FIgure 5
While interchange and other card acceptance fees as a share of overall expenses for merchants have increased over the years, this is primarily due to the increasing popularity debit and credit cards – which now combine for two-thirds of all purchases in the U.S. – relative to other methods like cash and check. In the five years between 2016 and 2021 total U.S. interchange revenue from debit cards grew 61.3%, or about 10.0% per year. However, the total value of debit transactions grew even more, at 73.6%, or about 11.7% per year.
Information regarding aggregate credit card transactions is less abundant, but data from Javelin Strategy and Verisk and cited by the Electronic Payments Coalition (EPC) shows that credit card interchange rates have remained largely flat since 2014, while the average MDR faced by retailers has only increased marginally – reinforcing the notion that costs are up largely due to the rising popularity of card payments rather than rising fee rates.
Benefits to Merchants and Consumers
Evaluating card payments solely based on the explicit fees that merchants pay to accept them vastly overstates the true costs. First, merchant activities necessitate the acceptance of at least some form of payment, and other payment methods – such as cash or check – themselves are not costless. Thus, any true evaluation of the costs of card acceptance should at least be weighed against the costs of alternative methods. Second, even though merchants subsidize the use of debit and credit cards through interchange fees, they likely benefit significantly from their use. Payment cards are extremely convenient for consumers, and the various rewards and cash-back programs associated with many credit and even debit cards often induce customers to spend more than they otherwise would – benefiting the establishments that make those sales.
The costs of cash can be substantial. One study concluded that cash-handling costs ranged from 4.7% to over 15% the value of the cash transaction, but businesses often fail to internalize these costs as the activities associated with cash acceptance fall under the responsibilities of store managers and other already existing staff, whereas the acceptance of payment cards requires explicit fees and the purchase of POS hardware.
FIgure 6
In one especially glaring example of how cash acceptance can drive higher expenses, Death Valley National Park in California transitioned to exclusively cashless payments after spending over $40,000 to process the $22,000 in cash it collected one year.
Further research that compares the costs of card payments to cash concludes that once the benefits of card payments are fully accounted for, debit and credit cards are most often cheaper. This is because cards are convenient for consumers; they reduce checkout times thus increasing customer throughput, and they remove the constraint that customers must have enough cash on their person at the time of sale, which contributes to higher transaction amounts (a phenomenon referred to as “ticket lift”). Credit and debit cards often provide consumers with incentives like cash back programs and airline miles as well, which can induce consumers to spend beyond what they would have otherwise spent using cash.
One such study from 2011 found that although the total costs including labor, hardware, and other direct/indirect costs for signature and pin debit cards used at supermarkets were roughly double the costs for cash acceptance, the increased ticket lift and throughput improvements led to a total net benefit for signature debit cards of $1.025 per transaction, compared to the net costs of cash of $(0.489).
Another study evaluating the effect of cash-back programs on consumer spending shows how consumers can rationally increase their spending when using a cash-back credit card in lieu of cash. Because cash-back rewards effectively lower the purchase price in a given transaction, price-sensitive consumers will end up spending more than if they had made the purchase in cash, even after accounting for the cash-back rewards. For example, a consumer with a price elasticity of demand of 1.5 receiving 2% cash back from credit card purchases would be induced to spend an additional $0.46 for each dollar in cash-back rewards received. To put this in perspective, given the $67.9 billion in rewards paid out by top issuers in 2022, consumer spending could have been $33.3 billion more in 2022 due to card rewards programs.
FIgure 7
The Regulatory Environment and Fallout from the Durbin Amendment
Debit card interchange fees have been regulated by the Federal Reserve since 2011 thanks to Regulation II, also known as the “Durbin Amendment” to the Dodd-Frank Act in 2010, while interchange fees on credit cards remain unregulated in the U.S. The Durbin Amendment caps interchange fees on debit cards from issuers with over $10 billion in assets at 21 cents per transaction plus 0.05% of the transaction amount, and an additional 1 cent fraud-prevention adjustment.
While the Durbin Amendment lowered the average interchange fee paid by merchants from an average of 51 cents per transaction for covered issuers (those issuers subject to the law) to 24 cents by 2021, the legislation was plagued by unintended consequences. In response to lost interchange revenues from debit card programs, 50% of card issuers subject to the amendment ended their rewards programs in 2011 – such as free checking, zero liability protection, and cash-back debit cards – contributing to an increase in the unbanked population in the U.S. of 1 million people from primarily low-income families. Researchers at the University of Chicago also concluded that after taking into account the lost perks and increased fees levied by issuers, consumers lost upwards of $25 billion.
The Interchange Fee Prohibition Act
According to the EPC, 29 states have introduced at least 61 bills since 2006 concerning credit and debit interchange fees. These efforts were especially concentrated in the years following the pandemic. More recently, Illinois was the first state to successfully introduce and pass legislation capping interchange fees in the state. Taking effect in July of 2025, the Interchange Fee Prohibition Act (IFPA) exempts merchants from paying debit and credit interchange fees on the sales tax and gratuity portion of any transaction, and levies a $1,000, per transaction civil penalty on banks or other parties who collect interchange fees on taxes and tips in violation of the law.
The law presents implementation challenges to all parties involved in the payment process. While it does effectively lower the amount of interchange fees paid by merchants, it will likely require an overhaul of merchant POS systems – and other systems involved in the payment card environment – which will impose substantial costs.
It’s difficult to determine the exact costs that the IFPA will impose on merchants, banks, and networks, but experience from the Europay, MasterCard, and Visa (EMV) rollout (colloquially referred to as “chip” card implementation) sheds some light on the likely magnitude. It’s estimated that upgrades associated with the implementation of EMV in the U.S. carried a total price tag of $8.6 billion, with other sources citing costs as high as $25 billion.
Given the language of the IFPA, there are three methods through which the law could be implemented.
Interchange Rebates
Merchants could seek refunds from their card acquirers for the interchange fees assessed on the tax and gratuity portions of their sales. However, because many merchants agree to pay a rate for each type of card they accept, the refund process would require these merchants to identify sales tax associated with each of the numerous cards they accept. This would impose significant administrative burdens on merchants, both acquiring and issuing banks, as well as the networks that facilitate the transactions.
Level 2 Data Upgrade
To bifurcate the tax amount from any purchase transaction all merchants engaged in business-to-consumer transactions would need to capture and transmit level 2 data, which includes more detailed information about each transaction including the taxes charged. This change would require merchants to upgrade their POS hardware, gateway subscriptions, their internal systems, and any other related hardware and services used during the checkout process. Beyond imposing significant costs on merchants, banks, and networks, level 2 data still does not capture any data on gratuity.
Dual Authorizations
Merchants could use two separate authorizations for each transaction involving state and local sales taxes and/or tips. This method would also require upgrades and changes to merchant POS and register systems, since each purchase would need to identify both the purchase price and the tax and tips portion of the sale. Adjustments to payment networks would also need to take place to prevent the charging of interchange on the tax authorization, and to prevent acquiring banks from paying interchange fees to the issuing bank. Also, because each taxable purchase would require two separate transactions, customers and merchants may run into situations where the purchase authorization clears, but the customer has insufficient funds in their account to cover the tax authorization. In such an event customers would have to pay the tax portion via cash or check, or the transaction would need to be cancelled, further increasing costs on all parties.
Regardless of how the law is implemented, it’s likely that smaller merchants will suffer the most due to the costs of implementation, while also benefiting to a lesser degree from the fee reductions than larger retailers. According to the EPC, the 1.3 million small businesses in Illinois are expected to save just $56 annually – a savings that likely falls short of any expenses necessary to implement the law.
Also, the public and policy makers may overestimate the savings that small businesses could experience because of the IFPA. Small businesses like convenience stores that frequently sell goods in small tickets will see much smaller relative savings in their interchange fees compared to larger retailers due to the fixed, per-transaction portion of interchanges fees – even if the total annual sales of the two merchants were identical. Using debit as an example the regulated interchange fee is a fixed $0.21 plus 0.05% of the purchase price including tax, with credit interchange often following a similar structure. Prohibiting interchange fees from being applied to the tax portion would only decrease the merchant’s interchange by the variable 0.05% portion of the fee, since the $0.21 would still be applied to the transaction for the original goods or service.
A typical convenience store with an average ticket value of $7.80 would currently pay $0.21390 in interchange on a debit transaction, while a larger retailer would pay $0.2450 on a debit transaction of $70. However, after excluding interchange on the tax portion the convenience store would pay $0.21358 – a 0.148% savings on their interchange fees. The larger retailer on the other hand would now pay $0.24215 – a 1.163% savings.
FIgure 8
The Economic Impacts of Interchange Fee Restrictions: A Colorado Case Study
The complexities and burdens associated with implementing a cap or prohibition on interchange fees similar to the IFPA are clear, but what remains is a more technical analysis of the direct and indirect economic impacts a state like Colorado could expect as a result of passing a similar restriction. As of this writing the IFPA has yet to go into effect in Illinois, and thus a post-implementation analysis is not possible. However, using macroeconomic modelling we can evaluate the likely impacts of such a law, and more importantly, whether it will negatively or positively impact the state’s economy.
To conduct this analysis CSI utilized the Tax-PI+ software for the state of Colorado from Regional Economic Models, Inc. (REMI). The Tax-PI+ software is a dynamic input-output (I-O) model allowing users to simulate the direct, indirect, and induced effects of policies impacting the state’s economy.
For this analysis CSI modelled the likely impacts of implementing the IFPA in Colorado via the dual-authorization framework discussed earlier. This framework allows for an easier conceptualization of the likely costs of implementation and is likely one of the more feasible methods out of a set of likely infeasible options that a state has to implement such a law.
Simulation Inputs
Interchange Fee Savings and Lost Revenue
The central input for the simulation is the interchange fees that would no longer be paid by merchants in Colorado, and the subsequent loss of interchange fee revenue by financial institutions operating in the state.
Using taxable sales data for Colorado for tax year 2023, along with average transaction details for credit, debit, and cash transactions, and average interchange fees per transaction, CSI estimates that merchants in Colorado paid over $101.4 million in interchange fees on the sales tax portions of all debit and credit transactions made in the state, or roughly 0.07% of all taxable sales revenue made in 2023.
For estimates of the interchange fees paid on the gratuity portion of sales in the state, CSI apportioned tipped income estimates from the U.S. Internal Revenue Service (IRS) to Colorado based on the state’s share of overall Adjusted Gross Income (AGI) for tax year 2021 – the latest year data of this nature was available. For example, a Congressional Research Service report notes that roughly $38 billion in tips were reported on W-2s in 2018. Grown to 2023 according to the growth in personal income in the U.S. of 32.7% yields a total tipped income of $50.4 billion. Given that total AGI in Colorado is about 2.1% of total AGI for the nation, CSI estimates that total tipped income in Colorado reached $1.0 billion in 2023. For simplicity CSI assumed this total tipped income amount was attributable to debit and credit transactions only, as tipped income – particularly from cash sources – tends to be severely underreported. For instance CSI estimates unreported tipped income approaches 20%, which is close to the proportion of all transactions completed using cash according to the Federal Reserve.
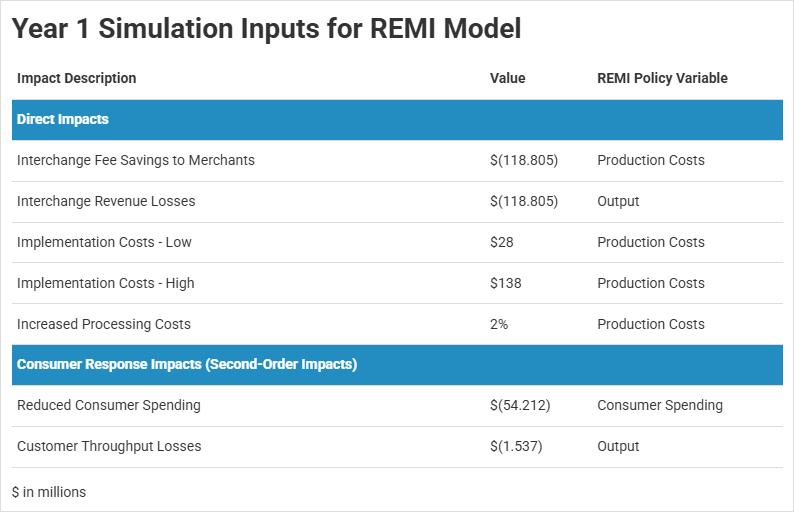
Following a similar process for calculating the interchange fees paid on taxes, CSI estimates that a total of $9.1 million in interchange fees were paid Colorado on tips in 2023, bringing the relevant interchange fees paid by merchants in Colorado – fees that merchants would be exempt from paying under an IFPA style prohibition – to $110.5 million annually. For comparison, the EPC estimated the total savings for merchants in Illinois from the IFPA at $118 million.
This amount represents both the total savings to merchants in the state whose sales are accompanied by sales taxes, and the total loss in revenue to issuers in the state.
Implementation Costs – Merchants
As discussed earlier in this report, any implementation of an IFPA style prohibition on interchange fess will carry significant costs for banks, payment processors, and merchants. According to the Small Business Administration’s Office of Advocacy, Colorado’s small businesses number 684,726, and represent 99.5% of all businesses in the state. Given an estimated $200-$1000 cost to upgrade a merchant POS terminal, CSI estimates the costs for merchants of implementation – including POS system upgrades, licenses and fees, and other costs passed down by gateways and payment processors as a result of changes to payment systems to accommodate the bifurcation of taxes and gratuity – could reach $28 - $138 million per year, assuming implementation occurs over a five year period.
Absent any definitive pathway to implement the IFPA, this cost estimate is highly speculative but demonstrates the potential magnitude of additional costs that significant changes to payment systems can impose on their users. As noted earlier, estimates for the total costs of implementing EMV (“chip”) cards reach as high as $25 billion. Apportioning these costs to Colorado based on relative GDP yields about $480 million in total costs for merchants in the state due to the EMV transition, or about $96 million per year over five years.
Increased Processing Costs
Like merchants and acquiring banks, issuers pay fees associated with the processing of payments. Many smaller institutions utilize the services of third-party payment processors to handle the behind-the-scenes functions that must take place to facilitate card payments. Based on conversations with experts within the payment card industry, CSI estimates the costs associated with payment processing can reach upwards of 2% of overall expenses, with many fees charged as a fixed, nominal amount per transaction. Under the dual authorization framework for implementing an IFPA-like cap on interchange fees, the number of transactions would effectively double as each purchase by a cardholder would necessitate one authorization for the purchase of the goods or service and another for the tax and/or gratuity. Therefore, CSI estimates that financial institutions in the state could face increased costs of 2% as a result of an IFPA-like prohibition.
Second Order Impact Estimates
In addition to the direct impacts discussed above, the analysis presented here contemplates indirect impacts to consumer behavior. As discussed in earlier sections rewards and cash-back programs associated with credit and debit card usage can spur increased spending from cardholders, both in terms of the cash back rewards received and even additional spending beyond the cashback rewards. For this analysis CSI considers the scenario where the reduction in interchange fee revenues corresponds to a one-to-one reduction in credit and debit rewards and increased banking fees. For each dollar of lost rewards, CSI assumes a $0.46 reduction in consumption.
Finally, the use of debit and credit cards has been shown to increase checkout efficiency indicated by increased customer throughput, which in one study amounted to a $0.156 throughput improvement per debit transaction for quick service and fast-food restaurants. CSI considers a 50% reduction in customer throughput for the fast-food industry in Colorado as a result of implementing dual authorizations.
Simulation Results
The simulation predicts that an IFPA style restriction on interchange fees would lead to a reduction in total employment of over 8,800 jobs by year five relative to the baseline assumptions of the REMI model, with jobs losses peaking at 9,117 in year three. These estimates amount to a 5.5% reduction in Colorado’s cumulative total employment growth over the next five years with significant industries like construction experiencing a relatively large share (15%) of the job losses. For the retail trade sector specifically, the model estimates a 75.9% reduction in cumulative total employment growth by year five.
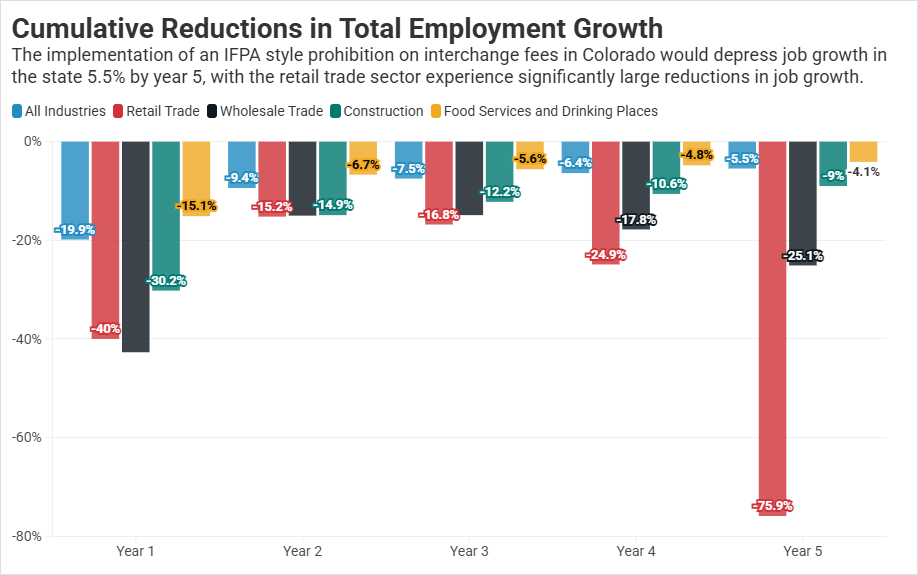
Figure 10
Colorado would also experience a $1.43 billion loss in GDP by year five, and a $1.1 billion loss in total personal income in the state relative to the model’s baseline scenario – a total loss more than 200% the cumulative savings merchants would experience as a result of the law over five years. Personal income would fall by over $1 billion, with real disposable personal income (2017 dollars) falling by $668 million by year five.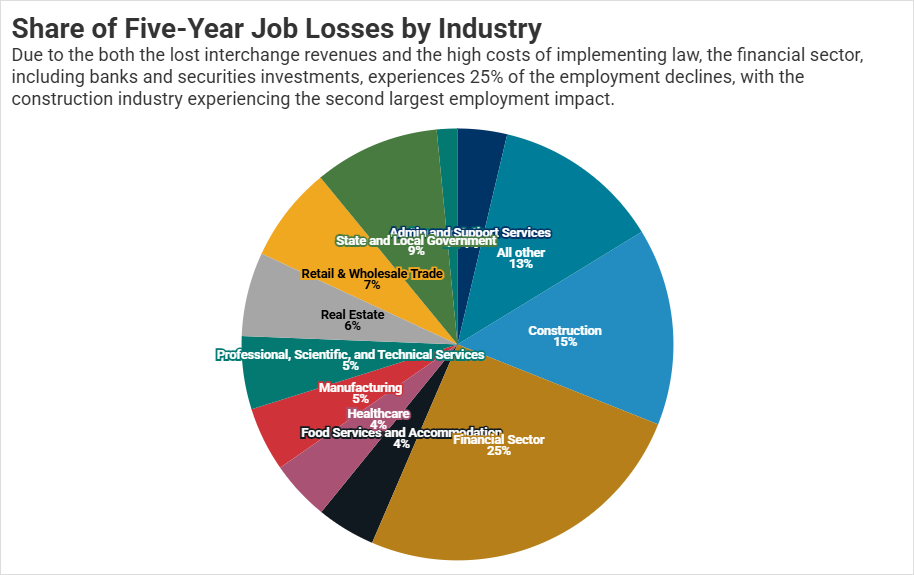
Due to the speculative nature of these estimates, CSI also contemplated a scenario excluding the second-order, consumer response impacts, while also using the low-end estimate for the adaptation and implementation costs ($28 million vs. $138 million). As anticipated, the results were less severe in this modified simulation but still resulted in economic declines throughout the Colorado economy. Total cumulative employment growth in the state falls by 3.6% in the modified simulation, with the state experiencing a GDP decline relative to baseline of $998 million by year five.
Final Notes
The impacts outline here are illustrative of the damage that such laws can inflict on a state’s economy. However, this analysis fails to capture some of the other likely implications, such as the distribution of the impacts discussed here. One example mentioned previously is that smaller merchants are likely to be disproportionately impacted by the costs of implementation, while simultaneously experiencing smaller proportional savings. The likely result of such a situation is an increase in market concentration in favor of larger retailers at the expense of smaller ones. Similarly with the financial institutions operating in the state, larger institutions – particularly those with a national footprint – will be better equipped to handle and distribute the costs associated with a law due to their larger customer base. These institutions would also see a smaller relative hit to their interchange revenues and operating costs, as Colorado represents only a fraction of their revenues and expenses. However, no such relief exists for smaller regional and state-chartered banks and credit unions, who’s revenues and expenses are near fully dependent on the local economy, and the laws that happen to be implemented in their home state.
Finally, it is worth noting that there is significant scepticism as to whether a law like the IFPA could be implemented at all. The simulation here represents the best-guess impacts IF the hurdles of implementation could be traversed. The difficulty with laws like the IFPA is that they impose state specific restrictions on a system that is set up to function across the globe. Modifying that system to accommodate the regulations in a single state within a single country is likely cost prohibitive for the parties involved. An equally likely outcome is that institutions would instead have to all together prohibit the use of debit and credit cards in a state that implemented such restrictions. It goes without saying that the economic consequences of this would exceed the estimates discussed here by orders of magnitude.
Bottom Line
Laws that attempt to restrict interchange fees are yet another instance of government price controls. These laws are often sold as a necessary government intervention to save consumers money, but in reality, they often impose significant costs on the very people they were intended to help. Policy makers and the public should be weary of arguments that exclusively point to the costs associated with the payment card system, without considering the alternative of if those systems did not exist, or the net benefits that accrue to the economy as a result of card payments. As this analysis shows, the pursuit to artificially limit the costs associated with payment cards can come with detrimental economic consequences.