Key Findings
- The total cost of crime in Colorado exceeded $27 billion in 2020. While costs are disproportionately felt by victims, this implies an average cost per Coloradan of $4,762 per year. The 2021 costs will grow, as the violent crime rate is on pace to be the highest since 1994, a 10% annual increase.
- $27 billion in total costs equates to 77% of the size of the state budget ($35 billion).
- $8.5 billion in tangible costs is $1.5 billion more than the combined total market value of the Broncos, Nuggets, Rockies, Avalanche and Rapids ($6.77 billion).
- Intangible costs related to victim suffering, reduced quality of life and other societal costs totaled more than $19 billion.
- Average monthly crime rate in 2021 is 28% higher than it was in 2011, and 15% higher than it was only two years ago in 2019.
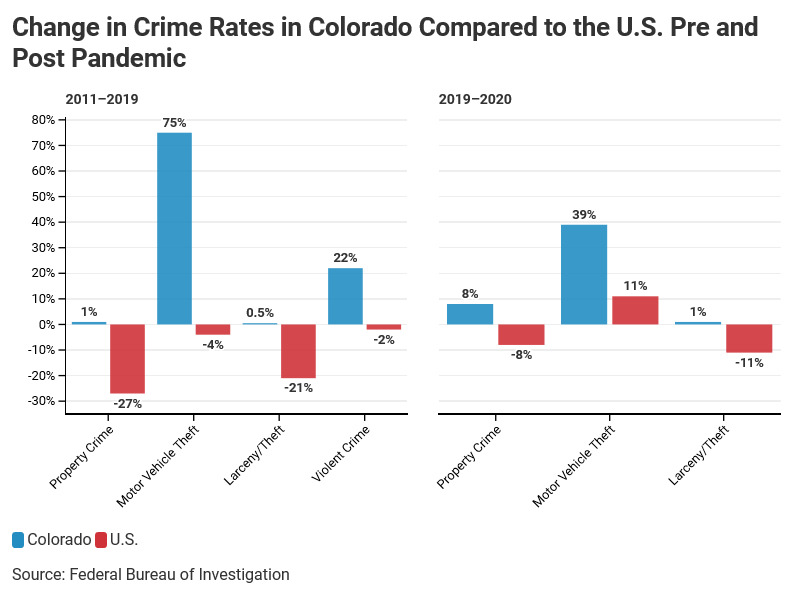
- Colorado had the highest increase in its property crime rate between 2011 and 2020, among all states.
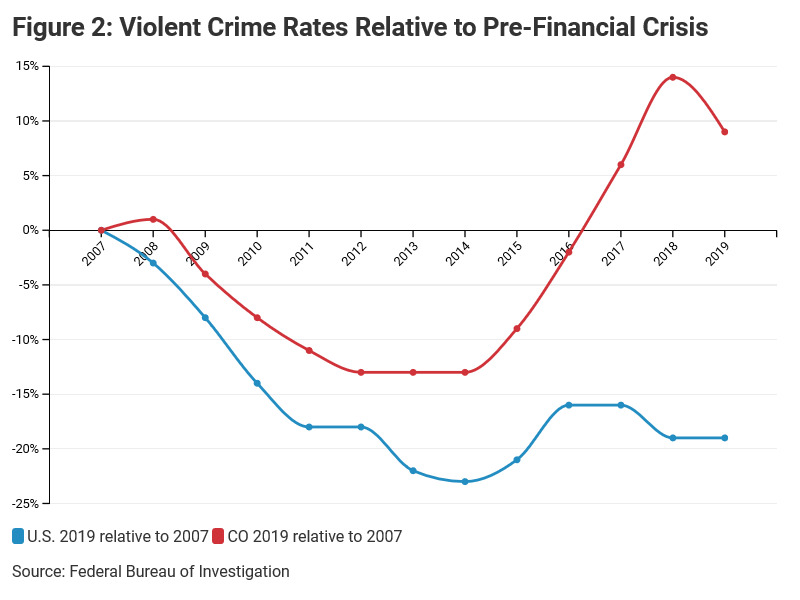
- Colorado’s violent crime rate in 2020 was 35% higher than 2011; nationally the rate grew only 3%.
- The 2020 murder rate was 106% higher than in 2011. The rape rate was 9% higher, with assault up 40%.
- Significant increases in organized retail crime and motor vehicle thefts contributed between $1.2 and $1.6 billion to total costs.
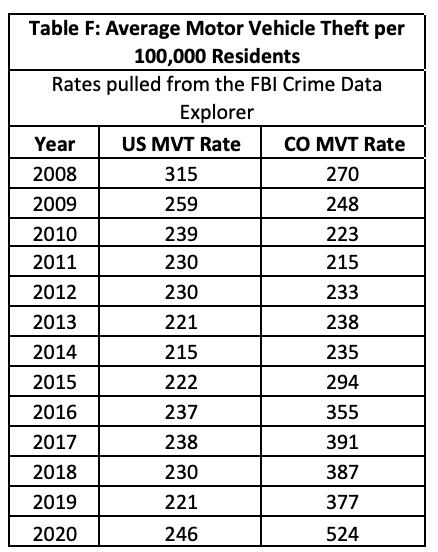
- Colorado had the highest motor vehicle theft rate among all states in 2020. Just 10 years ago, the rate of motor vehicle theft in Colorado was lower than the national average. Since then, the Colorado rate has increased by 135%, while the national rate has increased just 3% through 2020.
- As a result of multiple reforms, the trends across bond practices, parole rates, and incarceration levels, all point to a system tipping further away from accountability.
- Since 2008, the state correctional population has declined by 23% while the level of crime has increased by 47%.
- The Department of Correction population only, has declined 33% through 9/30/21.
- Colorado’s recidivism rate is top-5 in the nation.
- Of those arrested in Denver in 2021, 65% had at least one prior arrest since 2018.
- 30% had 5 or more arrests since 2018.
- Policymakers must establish more transparent reporting and a public facing information dashboard that demonstrates how the current system supports communities, victims and individuals returning to society following incarceration.
- Need for interagency task force on organized retail crime.
- Must understand how changes in the system are leading to worse outcomes.
Overview
Crime has undeniably and dramatically increased over the last decade in Colorado. The pandemic-related policy restrictions and resulting economic disruptions brought further stress to society, which exacerbated problems related to crime. The result has been billions of dollars in additional costs borne by Coloradans. These costs are felt in many ways, both directly by the victims, and indirectly by the community.
It is important to distill the jaw-dropping impact of crime down to numbers that everyone can grasp. The numbers show trends and enable conclusions, which in turn can be tested. Numbers remove the emotional impact and personal tragedy of crime and lead to dispassionate, practical solutions to what is, in part, an economic issue. All victims know that crime is intensely personal. Most people never fully recover from the impact of being victimized. Behind every statistic of violent crime, theft of valued possessions or any violation of one’s right to live a safe and secure life, is a person and that person’s family and friends – are each damaged by a criminal act.
The primary and consistent policy trend in Colorado has been to discourage the jailing of those arrested for committing crimes and to reduce the severity of punishment for those convicted. However well intended, these recent policies must be monitored to ensure the costs from the unintended – albeit predictable -consequences do not outweigh the anticipated benefits.
Given the concerning trends and high costs, it is imperative that policy makers implement timely, transparent, and actionable accountability metrics, that allow them to diagnose specific system level problems and individual policy decisions across the multiple dimensions of criminal justice in Colorado.
Let us move forward with the important work of understanding the impact of public policy on the lives of our community. While we’re interpreting data and delving deeper into cause-and-effect, we must also remember the thousands and thousands of victims who have
Colorado’s crime surge increased over the last two years but started long before the pandemic
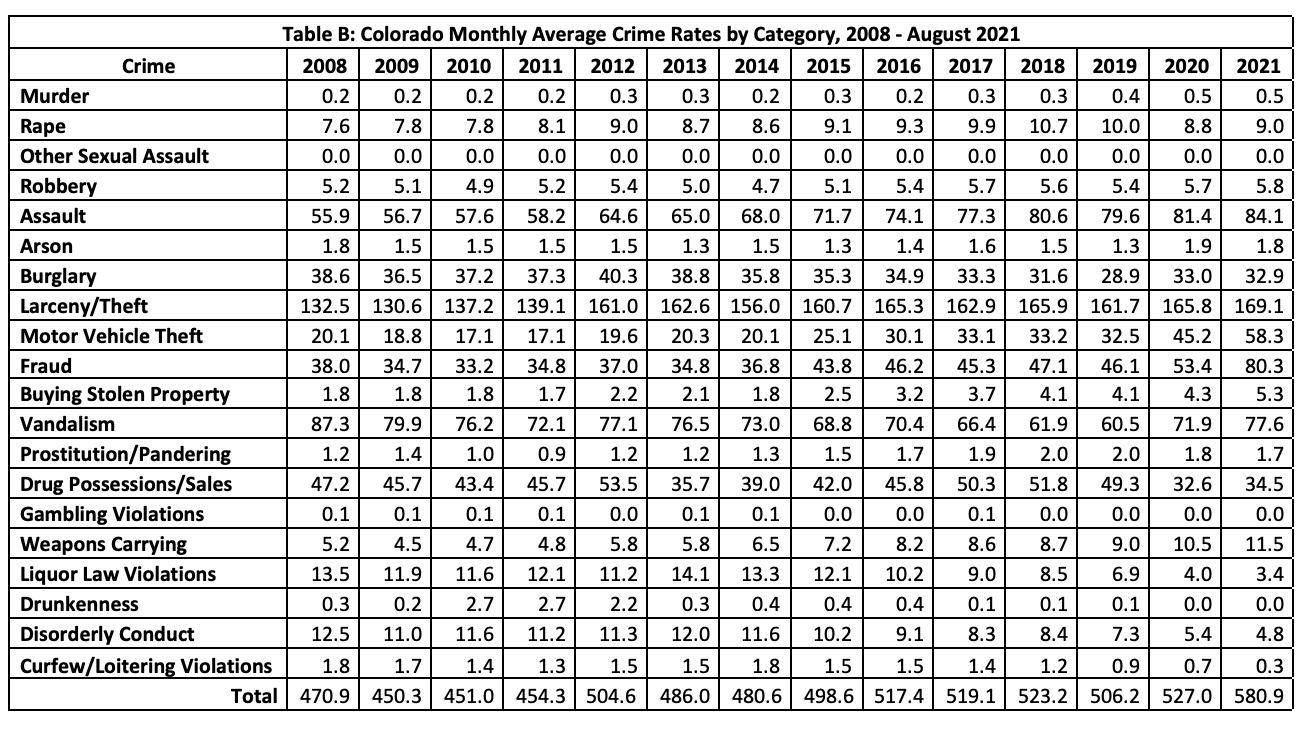
- From 2010 through 2019, Colorado’s population-adjusted annual murder rate increased by an annual average of 8%, motor vehicle theft by 6%, and assault by 3%.
- Average monthly crime in 2021 per 100,000 Coloradans is 28% higher than in 2011, and 11% higher than in 2020
- The monthly murder rate increased 20% in both 2019 and 2020
The 2021 total rate of crime is 14% higher than it was in 2019. This trend exceeds the 12% increase Colorado experienced between 2009 and 2012.
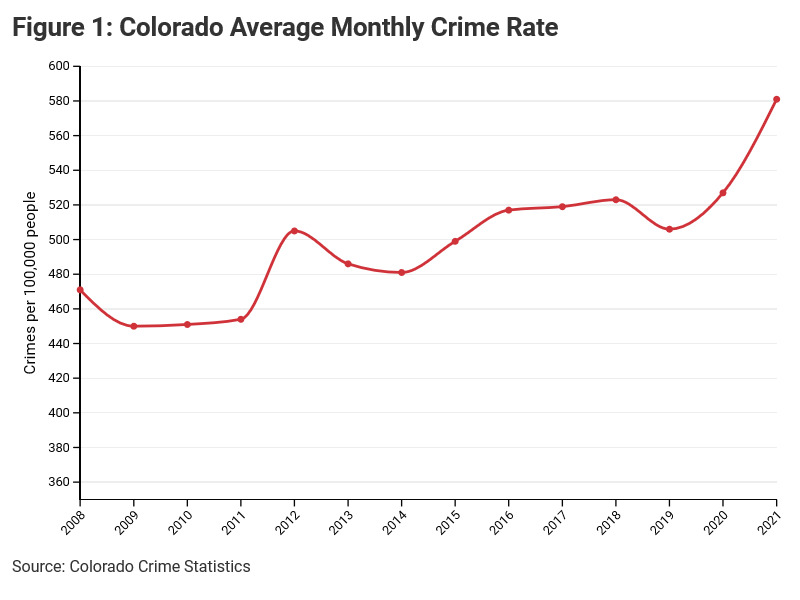
While it should be everyone’s hope that crime levels subside as the economy continues to recover, there must be attention to the fact that Colorado crime rates never recovered to their pre-financial crisis level heading into 2020. After adjusting for population growth, the 2019 murder rate was 82% higher than in 2009. The rape rate was 30% higher, and assault up 40%.
The national trend is the opposite. Figure 2 shows Colorado’s 2009-2016 dip in violent crime was reversed in 2017, and by 2019 was nearly 10% higher than 2007. Over that same period, the U.S. violent crime rate declined by 19%.
The 2020 violent crime rate in Colorado was the highest in a quarter century. And the current pace of violent crime is on track to be the highest since 1994.
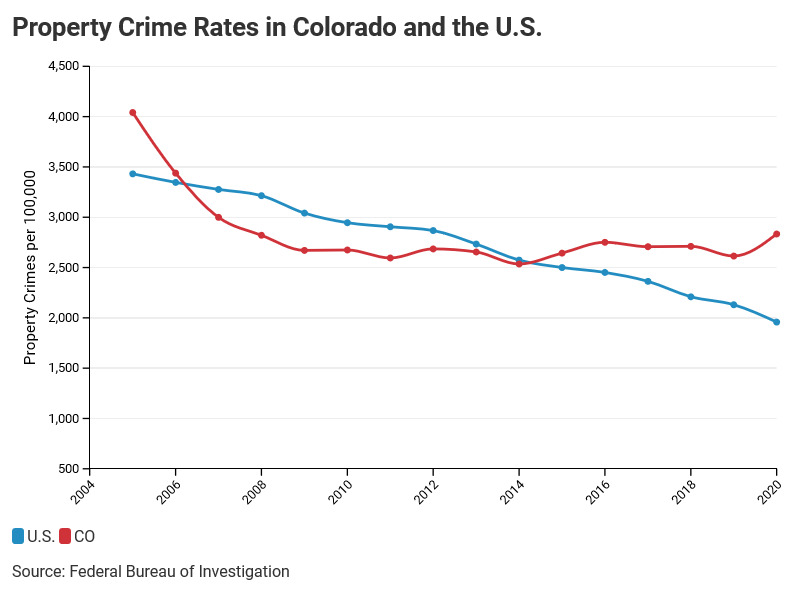
While Colorado’s violent crime rate is surging, property crime is defying the trend across America.
Nationally, the property crime rate has consistently fallen for the past three decades. Not so in Colorado, where the property crime rate has remained largely flat or even increased slightly since 2009. As shown in Figure 3, the national property crime rate declined by 30% between 2009 and 2019. In Colorado, it dropped by a mere 2%.
During the first year of the pandemic, the difference was exacerbated. Nationally, the property crime rate fell by another 8%. Colorado went the opposite direction, increasing by 8%. The increase in the property crime rate from 2010 to 2020 in Colorado ranks 2
nd among all states.
The 2021 overall crime rate through August of this year is worse. Through the first eight months of the year, the average monthly crime rate grew by 10%. The monthly average murder rate grew by 9%. For other property crimes, the surge is more dramatic. Motor vehicle theft is up 29% and fraud increased 50%.
The pandemic, resulting social unrest and economic struggles have undoubtedly played a role in exacerbating the underlying causes of crime. Yet, the long-standing trends should not be overlooked. And over the past 18-months, as all Americans have faced similar struggles, the rates of crime increased at much higher rates in Colorado than they did throughout much of the country.
The growth in crime is costing Coloradan’s tens of billions of dollars in both direct and indirect costs
- The total cost of crime in Colorado is more than $27 billion.
- Total tangible costs of crime are $8.5 billion while total intangible costs are $19 billion.
- The total cost of police-reported crime in Colorado is $10 billion.
- While total police reported tangible costs are $4.7 billion and total police reported intangible costs are $5.4 billion.
The costs of crime borne by society are felt in numerous ways. In early 2021, a scholarly article by Miller,
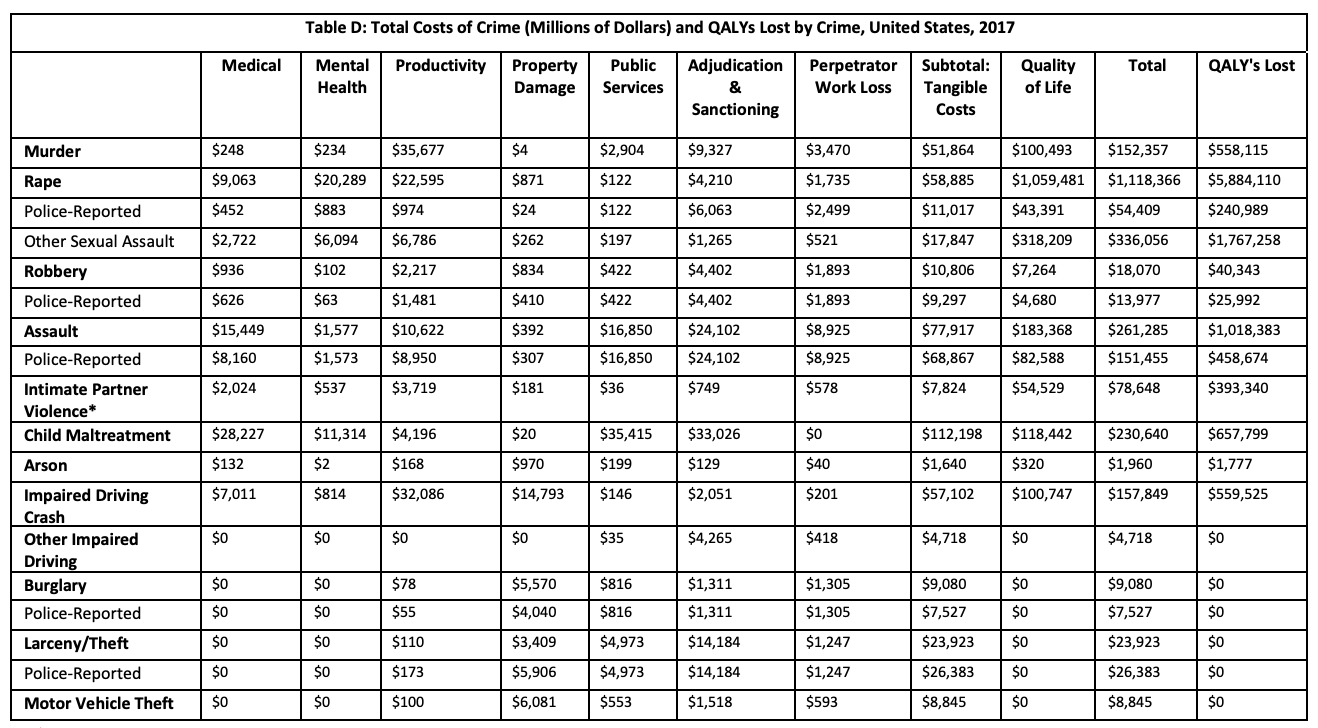
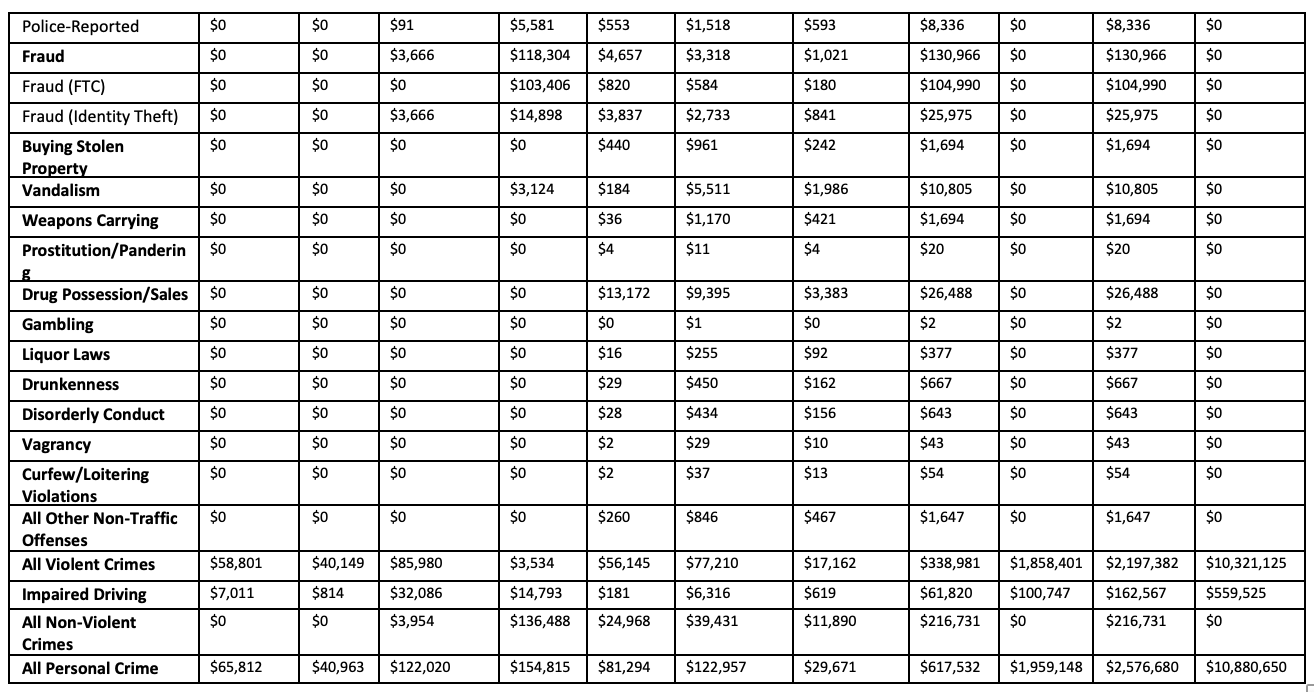
et al., found that “Approximately 121 million crimes committed in the U.S. in 2017 resulted in $620 billion direct monetary costs and $1.95 trillion in intangible pain, suffering and lost quality of life costs. Combined, the cost of crime in the U.S. in 2017 was $2.6 trillion.”
[i]
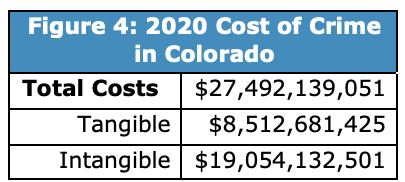
Through working with the report’s primary author, Dr. Ted Miller with the Pacific Institute for Research in Maryland, to replicate the methodology the total cost of crime in Colorado in 2020 was estimated to have exceeded $27 billion. This estimate reflects both adjustments to the relative costs of Colorado compared to national averages and the overall increase in prices since 2017. The total cost estimate is 1.07% of the national cost estimate. This is significantly lower than Colorado’s 1.8% of US population, primarily because the Colorado estimates excludes certain crimes committed by and against juveniles which were included in the national article. For this reason, these estimates are conservative in their estimation of the full costs of crime.
Figure 4 reflects the sum of costs across each category of crime. Table F in the Appendix shows the full costs across each category of crime and cost type. The large cost to society must be better understood when weighing cost savings, or benefits of policies moving forward.
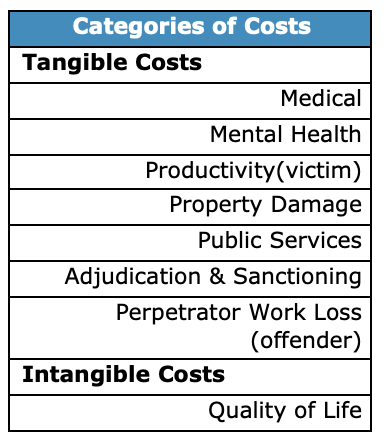
Some of the costs are more clearly understood and tangible to both victims and society. Tangible costs have a direct transaction cost associated with them. Victims of crime face physical injury, the loss of property, medical bills, and massive time and resource commitments to pursue legal charges. Federal, state and local taxes pay for policing, courts and our prisons and jails. While serving prison sentences resulting from their crimes, convicted felons are no longer able to be productive members of society and participate in the workforce translating in a reduction in their contribution to our economy or their family’s income.
There are also costs which are intangible in nature yet take a real toll on communities. In areas with higher rates of crime, quality of life suffers, which results in both psychological impacts and behavioral changes. They also reflect tangible costs possibly not captured in the analysis. The article by Miller,
et al., states that quality of life costs or intangible costs provide “monetary value of pain, suffering and lost quality of life.” Specifically, “violent crimes are assumed to reduce victim quality of life. Thus, to the extent fraud and other crimes involve mental anguish, these costs would be higher.”
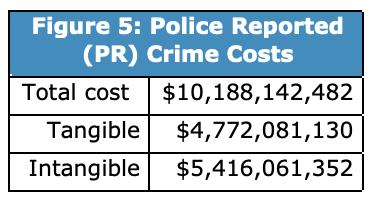
Many crimes go unreported to police. Therefore, this analysis accounts for the 1,500,000 more crimes that occur that are not reflected in the police-reported offenses. The categories of crime that have the biggest difference between what is police-reported and what is estimated to actually occur, are sexual assaults, with rape in particular, and fraud. According to Miller,
et al., less than 3% of rapes and just 3.4% of fraud get reported to police nationally.
Two of the most significant areas of growth in costs and impacts are motor vehicle theft and retail crime
- Colorado has the highest auto theft rate of all states (Washington, D.C. is higher).
- If the monthly pace of motor vehicle thefts keeps up, motor vehicle theft crime rates in 2021 will be 79% of where it was in 2019.
- Total theft costs are approaching $1 billion annually in Colorado.
While the increase in violent crime is most pressing, the impacts related to the spike in auto thefts and retail theft must be better understood. Not only are there significant costs of these crimes, but there is also a connection between them and an increase in more violent crimes.
According to the Colorado Auto Theft Prevention Authority, Colorado ranked first among all states (second only to Washington D.C.) in 2020. Only 10 years ago, the rate of motor vehicle theft in Colorado was lower than the national average. Since then, Colorado’s auto theft rate has increased by 135%, while the national rate has increased a relatively scant 3% through 2020.
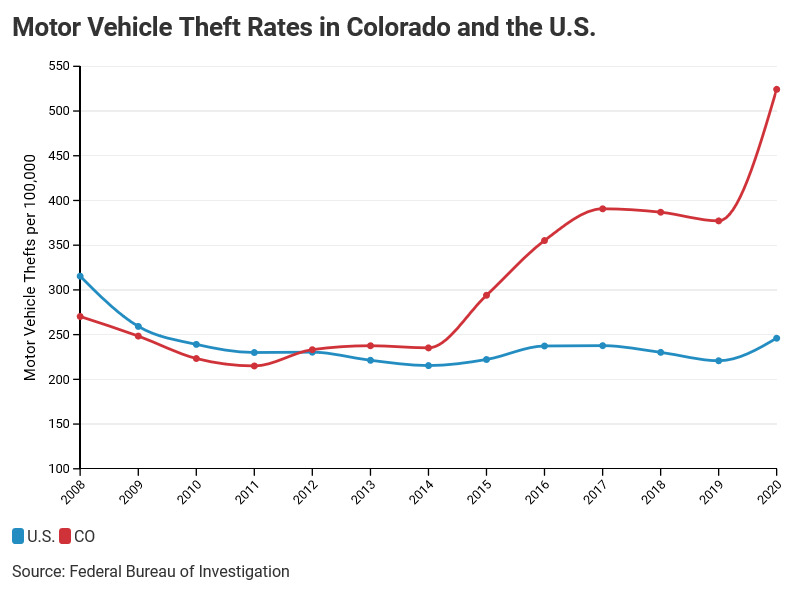
The last two years have been especially bad. The 2020 auto theft rate increased 39% and the current 2021 rate is set to increase an additional 29%, combining for a 79% increase since 2019.
Thefts of motor vehicle parts/accessories are just as concerning. Theft from a motor vehicle increased by 24% from 2019 to 2020 and theft of motor vehicle parts/accessories increased by 15%.
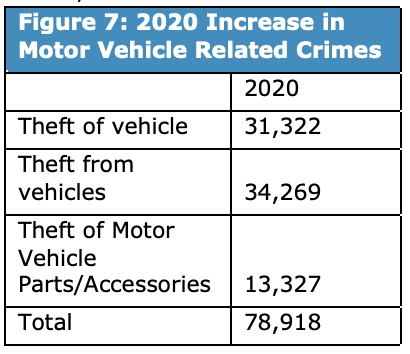
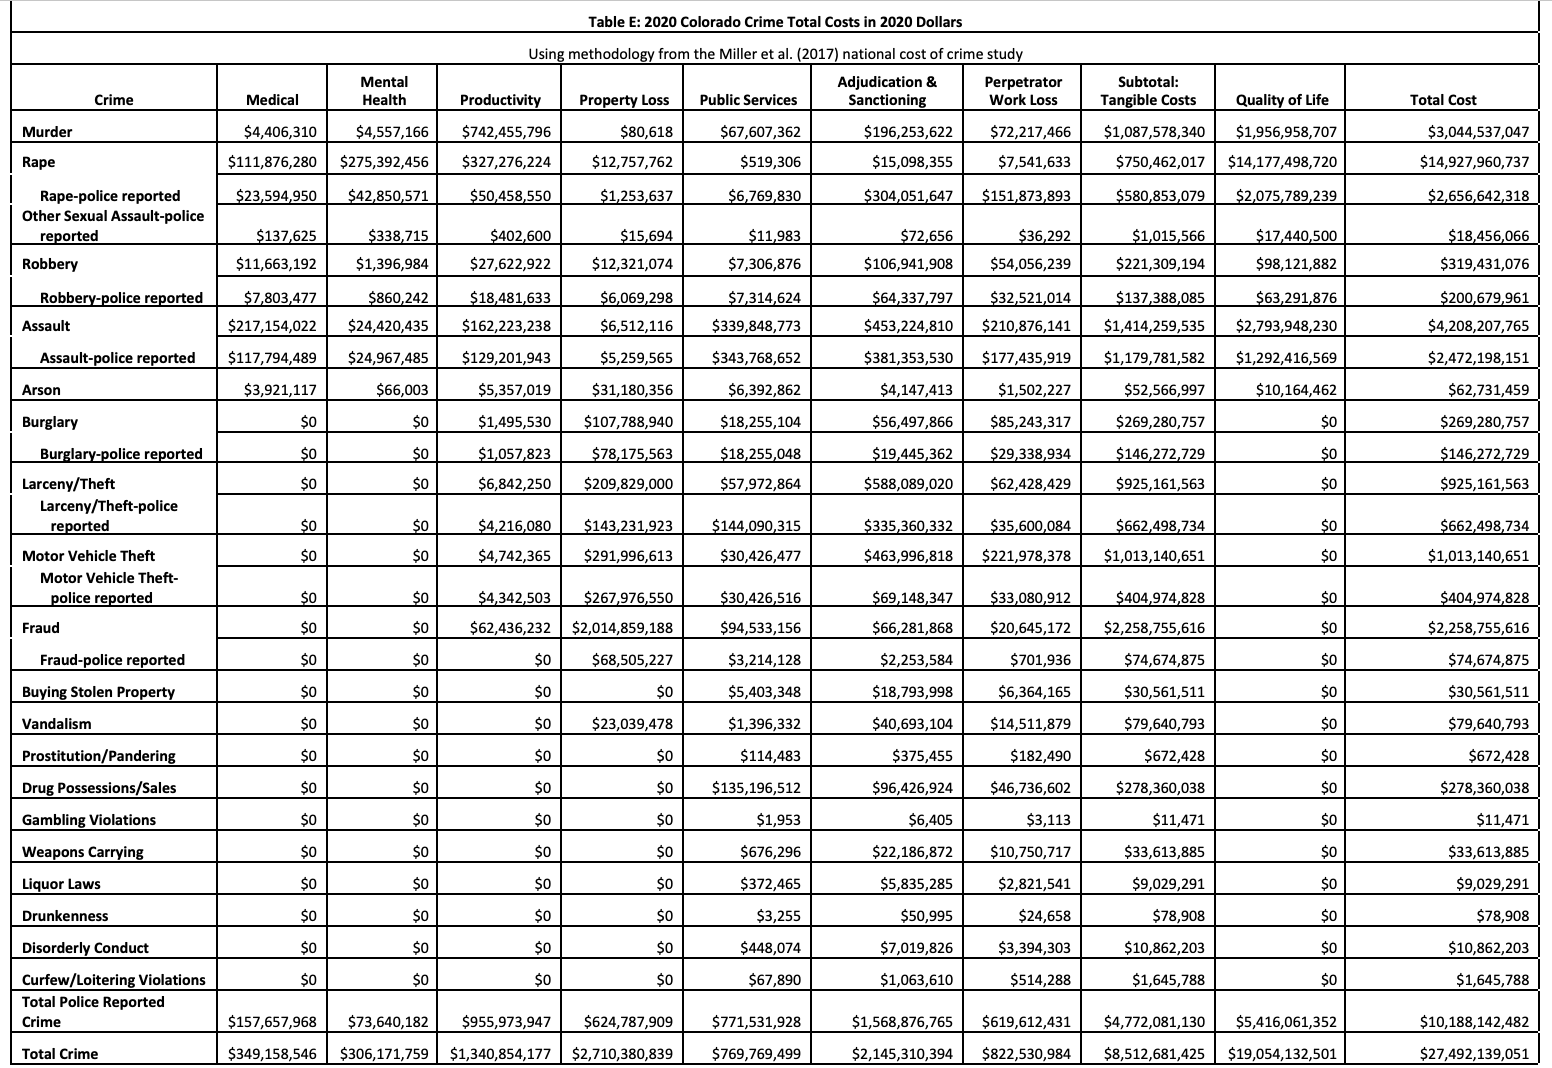
The costs of motor vehicle theft in 2020 totaled just over $1 billion. The largest costs resulted from property loss ($291,996,613), adjudication and sanctioning ($463,996,818), and perpetrator work loss ($221,978,378).
The 28,073 vehicles stolen in 2020, have an average cost of $36,090 per stolen vehicle. While 67% of reported stolen vehicles are recovered, the costs of these crimes span far beyond the value of the vehicle.
[ii] As a large portion of these costs are paid by insurance companies, the higher rates of auto theft led to higher insurance premiums for all Colorado drivers.
Since 2012, the rate of larceny and theft nationally has plummeted by 29%, more than 14 times Colorado’s anemic 2% reduction over the same period. The disparity between the national trend and Colorado is getting worse. In 2020 alone, the national rate of theft decreased by 1%. In Colorado, it shot up 11%. Further evidence of Colorado’s theft problem appeared in a November 2021 study, which ranked the Denver Metro area as having the worst rates of porch piracy of deliveries and packages.
[iii]
While these changes may seem smaller than the huge swings in auto vehicle theft, they obscure very sizeable increases occurring within the subcategory of retail theft.
Retail crime, and more specifically, organized retail crime (ORC) are areas of particular concern. The stories in the media and video footage of brazen criminals walking out of retail stores in front of employees and customers are shocking yet are sadly becoming more routine. A recent survey of asset protection managers found 67% report a moderate to severe increase in organized retail crimes.
Despite the increased news coverage and multiple surveys, a detailed understanding of how large the problem is across the state is lacking. Unlike for auto theft, there is not a single coordinated, cross-jurisdictional task force responsible for building cases against the most prolific offenders. Given the fact that retailers operate in a competitive marketplace, they are understandably reluctant to disclose detailed internal financial records.
Figure 4 shows the estimated total cost of larceny/theft for Colorado in 2020. According to the national methodology developed by Miller,
et al., police-reported larceny/theft cost $662.5 million and total larceny/theft cost about $925.2 million in Colorado.
While our modeling of costs estimated the value of property losses from theft to be $209 million or an average of $1,250 over the 114,813 reported thefts, there are several other sources that put the cost of just retail theft, and organized retail crime specifically, to be much larger. A November report by John Dunham and Associates on behalf of the Retail Industry Leaders Association (RILA) titled “The Impact of Organized Retail Crime and Product Theft in the United States” estimated the total value of stolen retail products in Colorado to be $642.2 million in 2019. This estimate is before 2020 and the increases over the last two years; a 20% increase raises this total to more than three-quarters of $1 billion.
Beyond just pinning down the full value of stolen products, the full costs are felt by all Coloradans, both as consumers and employees. Stores which face more severe rates of theft make up for the losses in different ways. To the extent possible, some increase security costs, while others write off the losses. Both can translate to higher retail prices for consumers and in the most damaging cases, store closure. The local community also suffers, as higher rates of theft deter vital capital investments and halt the influx of new companies, economic opportunities and jobs.
Of equal importance is the connection between thefts and violent crimes. In retail thefts, both customers and employees are subject to real threats of violence. The same national survey of loss prevention professionals, conducted by RILA, found that 86% reported verbal threats of bodily harm against an associate.
[iv]
The data from motor vehicle theft is also compelling. In 2020, there was a 45% increase in robbery/carjackings and a 32% increase in burglary/breaking and entering crimes charged at the same time as the auto thefts.
Concerning trends in the outcomes across the criminal justice system reflect how one-sided policy changes over the years have altered the system
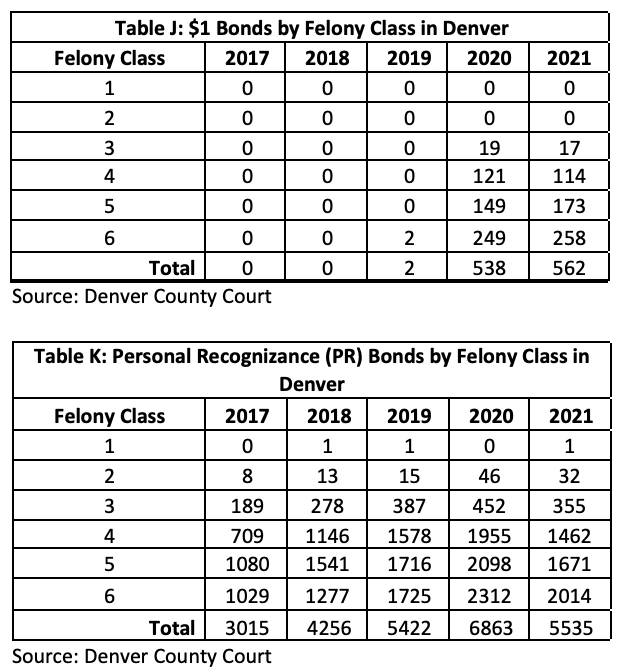
- Denver has increased the use of Personal Recognizance (PR) bonds by 61% over the last 2 years, including increasing use for more serious crimes.
- In 2018, the Denver courts issued only 29 $0, $1 or $2 bonds. In 2020, the number of low value bonds escalated to 574, a 1,879% increase.
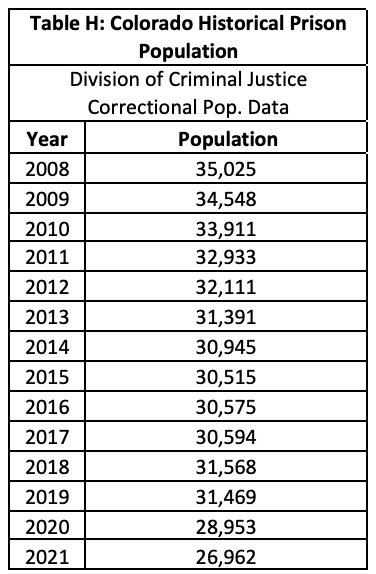
- Colorado’s prison and correctional population also began decreasing simultaneous to the surge in the crime rate.
- In 2021, 65% of arrests in Denver were of people who had at least one other offense in prior 3 years. 30% had 5 or more arrests since 2018.
Understanding the overall crime rates is an important starting point, but the analysis cannot stop there. Colorado needs a deeper understanding of how recent changes in the criminal justice system impact the rate of crime. Across the board, the trend has been to reduce sentencing requirements and to lessen sentencing outcomes for offenders.
Several recent policy trends seen within the system require greater evaluation to determine their causal relationship to the massive increase in Colorado crime.
Evidence from Denver County Court records shows a significant increase in the use of personal recognizance (PR) bonds and very low cash value bonds, even for more serious offenses, including gun crimes.
- The number of PR bonds in Denver increased by 61% over the last two years and has even increased for more serious crimes. PR bond issuances have increased by 254% for Class 2 felonies from 2018 to 2020. (Appendix Table L)
- In 2020 there were 538 $1 bonds issued and in 2021 there were 562. Between 2017 and 2019, there were only 2. (Appendix Table K)
Despite an increasing crime rate and growing population in Colorado, the total correctional population including jail and prison populations have decreased.
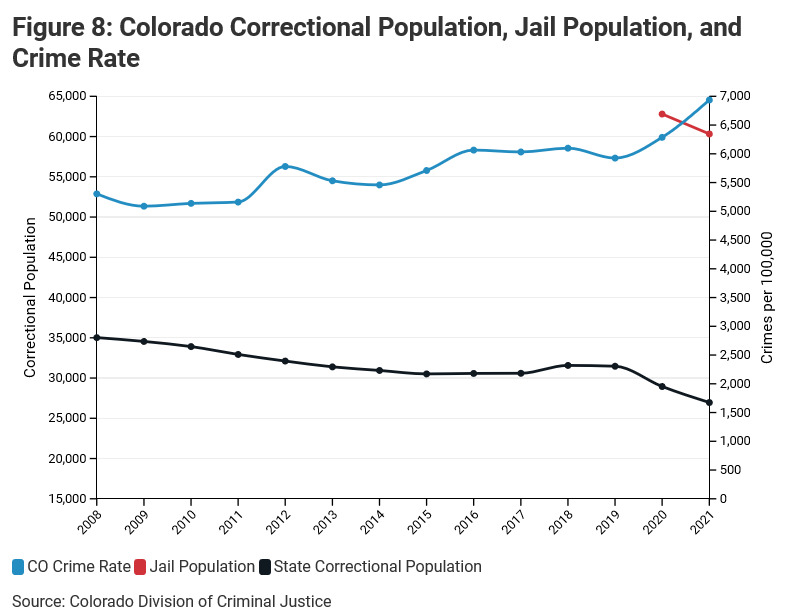
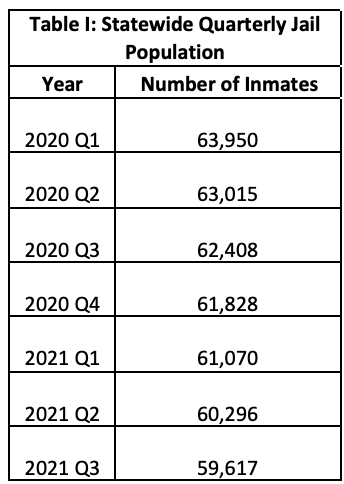
- Early in the pandemic, Executive Orders required a reduction in the prison population. Since 2019 the correctional population has declined by 4,500 individuals or 14%. A 2019 law required county jail populations to start being reported during the first quarter of 2020. These new records show a decline in the jail population of nearly 7% or 4,300 individuals.
- While the drop in the correctional population is sharpest over the last two years, the total number of individuals within the corrections system had declined by 10%, or by more than 3,500 individuals, between 2008 and 2019.
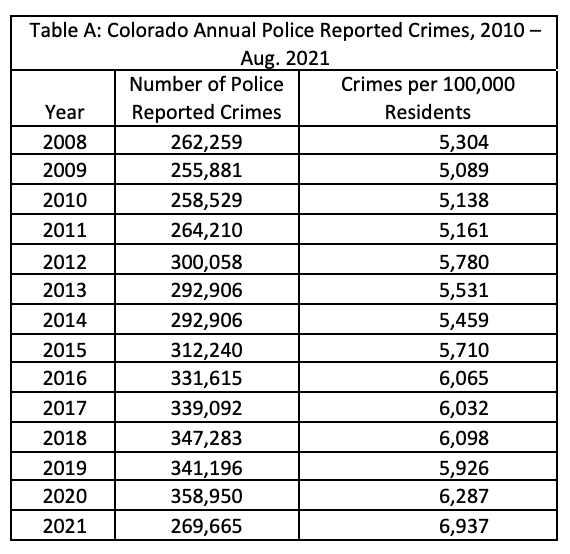
- This means that between 2008 and 2021, the Colorado correctional population has declined by 23%, or by more than 8,000 indvidiuals. During that same period the total number of annual crimes has increased by 47%, or by 131,399 annual crimes.
- Isolating just the population under the Department of Corrections shows a 33% decline between 2008 and the end of September 2021, or a reduction of 7,698 inmates.
Providing people an easier pathway for leaving the system of incarceration and becoming a productive member of society are worthy goals, but consequences to the community need be evaluated. Of particular concern are the following statistics:
- The state’s recidivism rate is top-5 in the nation.[v]
- 65% of individuals arrested in Denver in 2021 had been arrested at least one other time since 2018. 30% of individuals arrested, or nearly 1 out of every 3, had 5 or more arrests since 2018.
- Parole rates for more serious felonies have increased. Since 2016, the number of individuals granted parole more than doubled for each class of felony. The parole rate for class 1 felonies increased from 27% to 67%. The number of individuals who committed class 5 felonies that were granted parole increased by 313% as the rate of parole increased from 59% to 67%.
- A special report from the Colorado Auto Theft Intelligence Coordination Center found that the average number of auto theft cases per offender increased from 1.29 in 2019 to 1.7 in 2020.[vi] The reported concluded that either, “Repeat offenders made up a larger share of MVT cases…” or “MVT suspects were not being arrested, detained, or appearing in court, although MVT cases continued to be filed and arrest warrants issued. Neither scenario changes the fact that MVT case filings escalated in 2020, while MVT suspects operated with virtual impunity.”
Therefore, while the declining prison population itself does not give clear evidence of a connection to the increased crime rate, it should catalyze greater scrutiny around the data on recidivism and the rate at which individuals who commit crimes are held accountable through the system. This must be done in a way that encourages lawfulness, diminishes recidivism, and enhances public safety.
The path forward should include a comprehensive review of available data to address any unintended consequences and higher costs brought about by recent policy
- Decision makers need better transparency into not only the outcomes of the system in terms of crime, but also how the different factors of the system are performing.
- Create a data dashboard of both counts of crime/prisoners counts as well as indicators of outcomes across key areas that have clear connection to deterrence and reducing crime. The indicators need to provide the public with confidence in the system and give clear insights into where policy actions may be needed. If desire to have lower standards of being released on bail, then need to have systematic approach to ensuring they are not re-offending. If desire to not hold people longer, then need to ensure not re-offending.
- Need to adapt to growing threat of organized retail theft. Similar to the Metropolitan Auto Theft Task Force, a dedicated task force focused on organized retail crime should be formed. A model to refer to was recently formed in Utah: Crimes Against Statewide Economy (CASE) Task Force in Utah.
The recent surge in crime in Colorado, accompanied by significant red flags in the workings of the criminal justice system, calls for urgent action. The starting point should be a systematic and transparent review of how well the different aspects of the criminal justice system are performing. The review should also establish a set of relevant and actionable indicators that will allow for deeper insights into where potential system-level problems are occurring.
This information will help policy makers and the public better understand why the rates of crime in Colorado differ significantly from the national averages. From there, changes to the system can begin to create improved outcomes.
There are several crucial areas of data and information sharing that if routinely updated and displayed, could serve as a starting point for substantive policy discussion.
- Connection between property crime and violent crime – There are many instances where repeat offenders of property crimes, eventually commit more serious crimes. While each anecdote is compelling, it should be possible to review the number of violent crimes committed by those that commit repeat property crimes. Are those that are being released on PR or low dollar bonds committing more crimes? Are they showing up to court? Are jails accepting low dollar warrants?
- Rates at which parolees and those out on bond commit crimes – This information should also be associated with the initial offense type and bond amount. Just as important as understanding the rate at which individuals re-offend, it will also provide the rates at which individuals do not. A 2018 report, using 2016 as the most current year of data, from the Division of Criminal Justice analyzed the rates at which those released on PR and low cash bonds re-offended.[vii] It concluded that the value of the bond did not consistently change the rates at which individuals fail to appear to their court date and i. However, it doesn’t reflect the extent to which those out on low cash value or PR bonds re-offend. Given the significant changes in the use of these types of bonds since 2018, it would be impactful for future discussions to have routinely updated figures. Another key piece of information would be understanding not just rates at which individuals fail to appear across different bond types, but whether there is even any consequence for not appearing as policy at jails has changed related to misdemeanors and bond values.
- True impacts and rate of organized retail time – The state should establish an organized retail crime task force. This type of task force was recently formed in Utah and would operate similarly to the auto theft task force that currently exists in the Denver metro. It would allow for greater collaboration to both identify and prosecute offenders, as well as raise public awareness of the issue.
Conclusion
The system and those interested in sustaining the loosening of punishments should also be able to justify to the public that the costs are not outweighing the benefits.
A significant rise in crime does not help those who deserve to be released early or be afforded cashless bail.
The evidence is clear. The trends related to crime are going the wrong direction in Colorado. Despite steady declines in property crime rates nationally, Colorado has seen increases. While the nation has experienced a rise in violent crime, the rate of increase was more than double in Colorado.
As crime rates increase, the criminal justice system is reducing the probability that criminals will face accountability for their offenses to society.
Moving forward, improved transparency and reporting can establish a shared understanding of the full impacts of recent policy changes and help identify much needed solutions.
Appendix
Source:
https://coloradocrimestats.state.co.us/tops/
Source:
https://coloradocrimestats.state.co.us/tops/
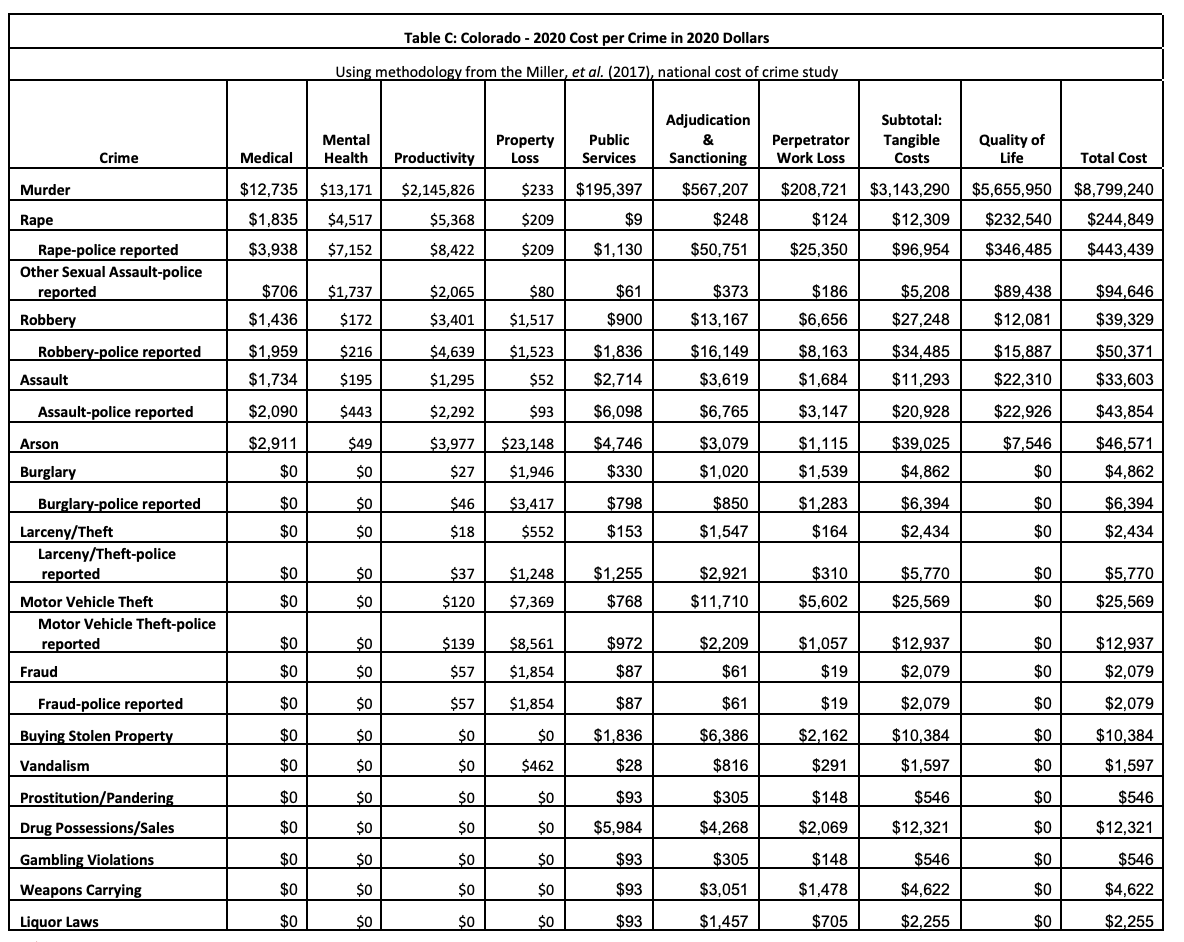
TABLES C – E Economic Cost Tables
The following set of tables provide both the costs per crime and the costs of each category of crime, for each type of cost. The tables show both the US figures as reported in the national study, C-E, along with the Colorado figures as derived by CSI replicating the national methodology.

*Excludes cases police reported as assaults.
Source: CDE :: Crime (cloud.gov)

Source:
https://coloradocrimestats.state.co.us/tops/
Source: Quarterly Correctional Populations | Division on Criminal Justice – Office of Research and Statistics (colorado.gov)
Source: Jail Data Dashboard (HB19-1297) | Division on Criminal Justice – Office of Research and Statistics (colorado.gov)
[i] Miller, T., Cohen, M., Swedler, D., Ali, B., & Hendrie, D. (2021). Incidence and Costs of Personal and Property Crimes in the USA, 2017.
Journal of Benefit-Cost Analysis, 12(1), 24-54.
[ii] https://coloradocrimestats.state.co.us/tops/
[iii] Worst Metro Cities for Package Theft for 2021 | SafeWise
[iv] Study: Retail Theft Balloons to over $68 Billion (rila.org)
[v] Recidivism Rates by State 2021 (worldpopulationreview.com)
[vi] Special Report, “Contributing Factors Behind the Rise in Colorado Motor Vehicle Thefts in 2020.” Auto Theft Intelligence Coordination Center, Colorado Auto Theft Prevention Authority.
[vii] ORS: Bond Reform Impact Analysis - HB 13-1236 (March 2018) (state.co.us)