Introduction
Rapid economic and population growth in Arizona’s dry central valley has created tremendous wealth and opportunity. Rapid development also has caused many state and national leaders and several members of the media to declare the region “out of water” and to demand an end to growth as the solution.[i] [ii] [iii]
For the state’s history, including its indigenous period, Arizona’s desert central valley has depended on forward-thinking strategies to import much-needed water – from a combination of natural rivers to man-made canals. After completing the Central Arizona Project canal in the late-20th century, the strategies and the infrastructure building largely stopped.
Like other southwestern states, it is clear the valley is in need of more water than the Colorado River alone can reliably support. There are other water supplies available, however, given the means to use them. Development and growth do not need to be curtailed.
Given the relatively small water needs for most non-agricultural purposes and for residential development in the water-efficient urban core of our state, Arizona could solve the valley’s water problems with infrastructure — even if that water ends up being relatively expensive and if rural agriculture continues demanding the lion’s share of the supply. Current law treats water as a common public good; there have been only limited experiments so far with privatization and exchange. While these markets have not yet been tested, they show promise.
Stronger price signals and investment in new engineering, along with legal solutions to augment the state’s water supply, could sustain the valley’s growth for another century.
Key Findings
- The conversation has become a drought management, when it should be about infrastructure. Water always has been scarcer in the western portion of the United States than it is along the eastern seaboard, but this resource is especially scarce in the dry deserts of central and southern Arizona. For centuries, however, residents have been able to solve these challenges by engineering ways to move water from places of plenty to places of scarcity.
o While there are problems with overdraw in some specific basins, Arizona’s overall groundwater and Salt River systems remain healthy.
o The same cannot be said about the Colorado River. The river was overallocated a century ago, and, regardless of drought, today there are more users than the river alone can reliably sustain.
- New water sources will be more expensive than legacy options. Solutions to augment central Arizona’s water supply will require new infrastructure, technology, and agreements with existing rights-holders. All of this requirements will add costs. But years of history and dealing with these challenges indicate users will be willing to pay these higher prices to sustain growth.
- The marginal value of additional water in central Arizona is very high. Residential, industrial, and commercial water users in urban areas use a fraction of the water of that the agriculture industry consumes in rural Arizona, and the economic return on that water is massive.
o On average, for every acre-foot of water used in Maricopa County, the region today produces $110,000 in gross domestic product (GDP).
o While Arizona’s agricultural users demand more than 800 gallons-per-person-per-day, residential, industrial, and commercial users demand less than 200 gallons-per-person-per-day. Maintaining the groundwater-dependent homebuilding moratorium in the Phoenix Active Management Area (AMA) over the next decade could cost the state $2 billion in potential real GDP.
o Meanwhile, augmenting the county’s water supply by just 300,000 acre-feet could provide a net increase of $4.7 billion in GDP.
The Economics Of Water Are Changing
Arizona has grown rapidly over the past few decades and today it is one of the nation’s most significant economic success stories. A large driver of that growth has been the Phoenix metro area, in central Arizona, which is a comparatively dry region.
Commensurate with that growth and the relative scarcity of water, the economic value of water in Arizona has increased dramatically since 1985. (That year marked the completion of the state’s last major legal and physical infrastructure investment in the movement and allocation of its water resources.) In 1985, Arizona’s real GDP was $90.4 billion annually; today it is $358.9 billion. The state’s population in 1985 was 3.1 million. Since then, the population has more than doubled to 7.4 million.
Over the same period, water use has fallen. Using Arizona Department of Water Resources (ADWR) data on water use within the state’s AMAs, CSI estimates total statewide demand for water fell 16% between 1985 and 2022. Those declines were driven entirely by falling demand by the agricultural sector. Based on U.S. Geological Survey (USGS) data, CSI estimates there was a 6.5% decline in water demand between 1985 and 2015. Both datasets demonstrate the fall in water demand was driven by declining use by the agricultural sector.
Over time, the ratio of GDP to water use has risen from $18,800/acre-foot in 1985 to nearly $50,000 in 2021 on an inflation adjusted basis. (See Appendix A.) While imprecise, this number serves as an indicator of the average product of water.
Water also has dramatic relative return-on-investment by sector. As noted already, the agriculture sector is the biggest user of water in Arizona, and while the industry represents a relatively small part of total GDP, water is a relatively large part of the input costs for the industry’s products. In 2021, for example, every acre-foot of water used by the agricultural sector generated approximately $900 in statewide GDP versus $142,000 for every acre-foot used elsewhere. Additionally, it takes a lot more water to produce even that small agricultural output despite the fact that the agriculture sector does not need the type of high quality required for human consumption or high-tech manufacturing.
For context, the cost of construction for the entire Central Arizona Project (CAP) was about $4 billion[v], and the canal moves about 1.4 million acre-feet of water annually for an effective discounted annual cost of about $100-$200 per acre-foot over the life of the canal excluding operational and maintenance costs and depending on discount rate and other assumptions. When considering the canal’s actual reported operating expenses in 2023, effective cost per acre-foot of CAP water ranges from about $200 (rated delivery capacity) to $353 per acre-foot (at actual 2023 delivery volumes, when CAP reported delivering 774,305 acre-feet to customers).
In other words, the cost-effectiveness of alternative valley water sources can rise dramatically as CAP water availability falls.[vi] CAP itself reports average delivery rates for water service of about $300/acre-foot, a number that is consistent with CSI’s findings.[vii]
Of course, these figures should not be taken at face value.
First, they may falsely imply there is no relative value to using the state’s water resources for agricultural versus other productive purposes. That is untrue. Almost by definition, agriculture is the most water-resource-intensive component of the economy, and that use fuels the downstream sectors with less direct water demand. Agriculture, of course, also produces the food people need to survive.
The question is not whether water should to go agriculture, but what proportion and how does water use change at the margin.
Second, the numbers above simply represent the ratio of the total value of production to water-use; water’s relative contribution to that production can vary dramatically. Water is clearly more valuable as an input to agriculture than it is to other types of production. Indeed, based on an analysis of cost-of-production data from the U.S. Department of Agriculture (USDA), CSI estimates water is between 9% and 19% of the total economic costs of producing major cash crops in the United States excluding the labor, pumping, and other costs associated with acquiring that water.[viii] It is unlikely to be more than a fraction of input costs for most other production. This conclusion means that while water is likely to be a limiting factor on Arizona’s agricultural sector generally, and crop production specifically, relatively small amounts of water, even if very expensive, can enable substantial growth elsewhere.
Water is a productive constituent of GDP and the value of GDP to water used is substantial and increases over time. Today, it is increasing particularly quickly in non-agricultural uses and in the state’s urban core.
Development Occurs Where There Is Water
Figure 4 shows a satellite view of the United States at night. The image reveals a striking pattern: most of our urban development is concentrated in the eastern half of the country. Except for a narrow sliver of light along the Pacific coast, western and central United States are mostly dark. The greater Phoenix metro area is readily apparent, a pocket of urban light in the darkness of the American southwest, but that light is an anomaly in the west.
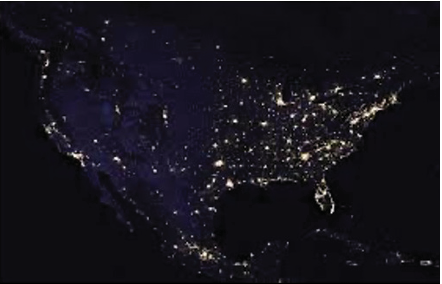
Figure 4
This image raises a question: why has the country developed this way? Part of the answer is natural topology. The Rocky Mountains, the largest mountain range in North America and the longest in the world,[ix] begins roughly in New Mexico and stretches north to Canada, south to Mexico, and west nearly to Nevada. The range cleanly separates the western and eastern halves of the country along a vertical fault that, at first glance, seems to correlate with the economic development gap revealed by U.S. nighttime imagery.[x] In fact, even back in 1878, without the benefit of satellite imagery, weather and geography researchers from the U.S. government identified the 100th meridian as a critical point separating the humid east from the arid west.[xi] (As Figure 5 indicates, west of the 100th meridian the average annual rainfall is much lower, below the 20 inches required for the farming of many crops.)
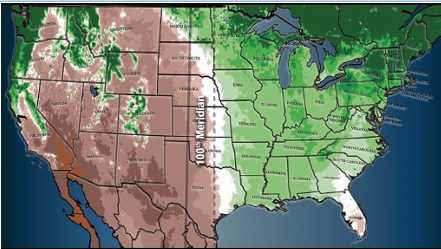 Figure 5
The Rockies are a proximate cause - along with the Gulf of Mexico and the interaction of warm, dry air in the west and cool, wet air in the east - of low precipitation.[xii] That interaction, coincidentally, that occurs roughly along the 100th meridian. The result? A western climate that is both warm and dry once it moves away from the Pacific coast and crosses the natural boundary that is the Rockies. Indeed, the difference is stark. Just along the meridian itself, average annual rainfall goes from 18 inches on its western edge to 24 inches on its eastern edge. Arizona, solidly west of the meridian, receives an average of 14 inches of rain annually. Alabama, about as far east of the meridian as Arizona is west, but situated at roughly the same latitude as Arizona receives more than 58 inches of rain per year.[xiii]
These weather patterns have clear consequences: In 1900, the population of Arizona was just 122,900 people[xiv] and Phoenix – then the state’s second-largest city – had a population of just 3,100 (tiny by and standard).[xv] For context, today the state is home to more than 7 million residents, and 4.5 million live in the arid greater Phoenix area (average annual rainfall: just 7 inches).[xvi]
Engineering, Infrastructure: Moving Water To Support Development
Arizona’s population and economy have grown despite its water challenges. But those challenges raise the question: How is this kind of growth possible?
Especially given the fact that, in the 19th century, researchers claimed about life on the arid side of the United States would be practically impossible.
Figure 6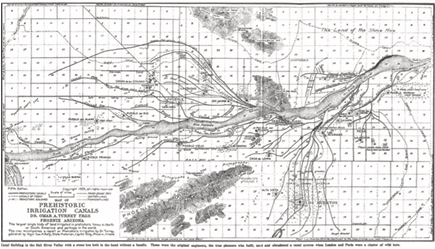
The answer is irrigation. As Figure 6 shows, as far back as 900 A.D., pre-European Indian communities in central Arizona had developed systems of irrigation canals to support their permanent habitation of the flatter, dryer parts of central Arizona.[xvii] These canal systems permitted tribes to move water, principally from the Salt River, to their permanent and semi-permanent communities, supporting populations of up to 80,000 people by some estimates.[xviii]
In 1902, the National Reclamation Act of 1902 provided for the creation of the Salt River Water Valley User’s Association and construction of the Roosevelt Dam, which, at roughly 72% of the systems total storage capacity, is the principal reservoir in the Salt River canal and reservoir system. By 1946, the Salt River system’s principal dams, reservoirs, and canal systems were complete and its water capacity built-out and allocated.
But the state was now growing rapidly — in 1940, Arizona had nearly 500,000 residents, and by 1950 that number had swelled to 750,000. It was becoming clear the Salt River alone could not permanently sustain growth trends in the central valley while also meeting existing obligations to early pioneering landowners who were engaged principally in agriculture.
Lobbying for a canal system to bring Colorado River water into central Arizona began in earnest in the mid-1940’s following the 1944 ratification by Arizona of the 1920’s-era Colorado River Compact, which ensured its access to Lake Mead and the Lower Basin allocation of Colorado river water.[xix]
The CAP canal system was authorized by Congress in 1968 and fully completed in 1993.[xx] At the time, the state’s population was 3.7 million. As noted above, today it is more than 7.1 million. Critically (as will become clear soon), securing federal funding for the project required Arizona give California senior priority to its water allocation in the event of a shortage.
Figure 7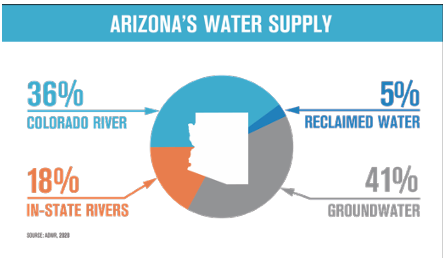
Figure 8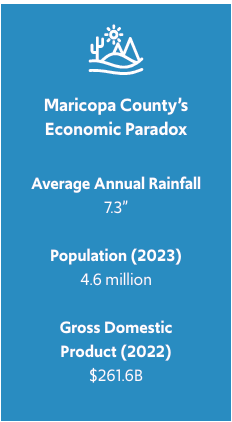
At 336 miles long, the CAP canal enables the flow of Colorado River water south from Lake Mead to Lake Havasu, and then east into Maricopa, Pinal, and Pima counties.
[xxi] With a capacity of 1.4-1.8 million acre-feet per year, as Figure 7 shows, today Arizona gets more than one-third of its water from the Colorado River and the CAP canal system.
[xxii]
According to data tracked and reported by the ADWR, within the central valley Phoenix, Pinal, and Tucson AMAs, 30% of all water supply comes from the CAP canals.[xxiii]
These engineering systems supported the desert valley’s rapid growth from a virtually unpopulated empty desert in 1900 to the 10th largest metro area in the United States.
As Figure 8 shows, today Maricopa County is the heart of Arizona’s economy, hosting about 60% of the state’s total population but three-fourths of its GDP. It does this with an average annual rainfall of just 7 inches,
[xxiv] or a fraction of that magical 20 annual inches that was alleged back in 1878 to be need for survival.
The Southwestern North American Megadrought
According to the National Oceanic and Atmospheric Administration (NOAA), the southwestern North American megadrought that began in 2000 has been the driest two-decade period in the last 1,200 years.[xxv] Over the past two decades, rainfall in the southwest has fallen by about 8.3%. In Arizona, average annual rainfall has declined by 0.92 inches per decade since 1990 for a cumulative decline of about 20% relative to long-range averages.[xxvi]
Reduced annual precipitation, along with reduced snowpack in the Upper Colorado River Basin peaks of the Rocky Mountains, has limited the inflow of river water into the region’s reservoirs, including — critically, for Arizona and the Lower Basin states — Lake Mead, which ultimately feeds the Colorado River system and supplies freshwater to 7 states and Mexico. As a result, the storage content of Lake Mead relative to capacity has fallen from 24.5 million acre-feet in 1999, or 95% of rated capacity, to a low of 7.8 million acre-feet in 2022, or 37% of capacity).[xxvii] Figure 9 demonstrates this drop.
Interestingly, these universal drought conditions have not produced universal water crises. Subject to annual and seasonal variation, the Salt River Project reservoir systems remain effectively full and their water availability unchanged since the 1990s, for example. As such, there are no plans for mandatory cuts in allocations of Salt River water to users and the wet year of 2023 necessitated the discharge of overflowing reservoirs.[xxviii]
Similarly, while there are specific groundwater basins in Arizona that have demonstrable shortages and chronic overuse relative to supply, there has been no clear general trend. Assuming average well depth provides a rough proxy for how full the groundwater aquifers are over time — or how difficult it is to reach groundwater from the surface — CSI reviewed ADWR discrete depth-to-water measurement data from more than 4,000 well sites between 1985 and 2023. In general, we found no clear trend of increasing well depth. In fact, since 2000 and the beginnings of the megadrought average well depth-to-water has been flat or even decreased. (A caveat: though this could be because the average groundwater level is unchanged or even increasing, it may also be the movement of well activity over time to areas with greater water availability. Still, there is evidence this approach works as a proxy measure of supply.)
Two groundwater basins with publicly-documented issues of supply struggles relative to natural recharge are the Willcox Basin[xxix] and Gila Bend Basin,[xxx] neither of which has historically regulated groundwater pumping through Arizona’s AMA model. A review of ADWR’s discrete well data for these basins found average depth-to-water has increased 31% since 1999 in Willcox Basin and 66% in Gila Bend Basin. Data also shows median well depth-to-water in Gila Bend has increased a staggering 120% since 1999. Additionally, despite ADWR’s recent announcement proclaiming the insufficiency of groundwater in the Phoenix AMA to meet current commitments over the next 100 years, the depth-to-water data do not yet reflect declining levels. In fact, in 1999 the average discrete depth-to-water measurement was 274 feet in the Phoenix AMA versus 261 feet in 2021, a reduction of 5.0%. Shallower wells suggest more water, not less.
So, what is going on?
While climate variability clearly plays a role in the availability and abundance of regional water supplies, the story of central Arizona, today and historically, has been one of using infrastructure to bring water to areas of need. Is the current period different, or is the issue today the same one faced in 900, and again in 1900, and again in 1950? Has the time simply come again to identify new sources of water and engineering solutions to acquire it?
The Colorado River system was probably overallocated 100 years ago
At the time the Colorado River Compact (CRC) was being conceived and negotiated, the southwestern United States was experiencing an unusually long wet period that lasted from about 1905 to 1941.
According to data published by the USGS, measured annual rainfall in the Mojave desert region during this period was more than 50 millimeters (mm) above average. (For reference, average precipitation has been 137 mm over the last century, which includes the mid-20th century drought).[xxxi] It was within this climate period that political negotiators decided both basins would be allocated 7.5 million acre-feet of Colorado river water annually, including the Lower Basin, which Arizona would share with Nevada and California. This total allocation of 15 million acre-feet was codified in the 1922 CRC. An additional 1.5 million acre-feet was later allocated to Mexico by treaty.
Later, litigation and negotiation codified Arizona’s share of the Lower Basin allocation at 2.8 million acre-feet annually. California received 4.4 million, and Nevada 0.3 million. To secure federal funding for the CAP that would transmit its share of Colorado River water into central Arizona, the state acquiesced to a lower priority position relative to California for its CAP-delivered Lower Basin water allocations during periods of drought.[xxxii] This part of the deal has become pertinent in the last few years.
At the time of CRC construction, the assumption was that annual inflows into the Colorado River would average about 16.4 million acre-feet, a number that was sufficient to meet the 15 million acre-feet in allocated demand plus the additional commitments to Mexico that were added later. Between 1906 and 2020, actual natural inflow measured just 14.7 million-acre feet, however, below the legal allocation made in 1922 and well below additional commitments added later.[xxxiii] Since 1999, ongoing drought has meant natural inflow has measured just 12.5 million acre-feet. Additionally, none of these commitments considered evaporation, leakage, or other losses inherent to systems of this kind.
Initially, this allocation issue was not a problem since actual recorded basin use did not approach the legal allocation until very recently. Combined with the large storage capacity created by the systems reservoirs, the river was able to accumulate large reserves during wet years that insulated the river’s beneficiaries during drier periods. For example, according to U.S. Bureau of Reclamation estimates, annual basin-wide Colorado River consumptive use was 6.4 million acre-feet in 1922 when the CRC was executed. As Figure 11 shows, by 1993, annual consumptive use had risen to 15.1 million acre-feet. At peak when the current drought began, the basin’s beneficiaries were withdrawing more than 16 million acre-feet annually.[xxxiv]
While the recent multi-decade drought conditions have accelerated and exacerbated the river’s structural issues, the underlying problem may be fundamentally unnatural and not necessarily climate-related: the legal allocation of river water exceeds the system’s ability to reasonably provide water given natural cyclical variations in inflow. Rapid population and economic growth in the Basin states, and particularly the three Lower Basin states (Arizona, California, Nevada), also have created new and ongoing demand for water resources.
Still, the fact remains that other potential water sources have proven more resilient during the drought. An efficient model that values this water and enables its voluntary transport to areas of best use, rather than first use, could secure Arizona’s ability to continue growing without sacrificing environmental security or general quality-of-life.
Solving The Real Water Crisis
While weather conditions and regional droughts could reduce available water for years or even decades at a time, the problem on the Colorado River is more fundamental: a lack of market incentives to use water efficiently. Prices and markets convey useful information about scarcity and demand. Today, the signal in Arizona’s water world is one of increasing value, but the strength of that signal is muted by the clear lack of real markets. Additionally, a system of grandfathered rights has struggled in vain to protect existing users at all costs — even if that system promises cannot be met via existing sources.
A complicated legal history
In general, water in Arizona is a public good. It cannot be privately owned. Herein lies the real crisis: drought is a contributor, not a driver. Individuals may acquire a right to use water, but they do not own the water.[xxxv]
Correspondingly, while the right to use water can be traded, the water itself is not typically bought and sold. Additionally, and most importantly, the sum of the individual rights to use water almost certainly exceeds the underlying physical supply in many systems.[xxxvi]
In turn, how the water right is determined varies by its nature.
Surface water is subject to the doctrine of prior appropriation, or, first in last out. As water becomes scarcer than its allocations can support, users are prioritized in order of when they first put the water to beneficial use.
This system is, generally, how the state’s surface water is allocated.
[xxxvii]
Figure 12 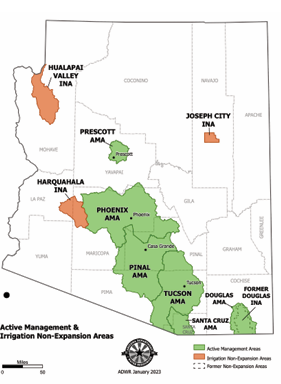
Groundwater, on the other hand, is subject to state law, the Groundwater Code, and the doctrine of reasonable use. Inside AMAs and under the state’s Groundwater Code, grandfathered rights for existing right-holders at the time of code application are prioritized and new uses of groundwater are permitted and monitored under various rules and regulations, including, in some cases, a 100-year-supply rule.[xxxviii] Transportation outside of the groundwater basin is generally restricted.
Within these frameworks, users have access to some tools to move water across time and within the state, including with underground storage credits and extinguishment and replenishment credits. While there are requirements that stored water be used, or recovered, within the hydrologic region — the basin or other underground reservoir, or along the same river-system for surface water in which it was stored — Arizona law since at least 1994 has provided for the creation and transfer of these storage credits between users. These transfers can include monetary compensation. In practice, they effectively create regional water markets using security-type instruments.[xxxix]
According to an analysis of credit transfers between 1994 and 2016 by University of Arizona researchers, there were 336 transfers of long-term water storage credits for 975,000 acre-feet of water in the Phoenix AMA, including 297 monetary transfers.[xl] Unfortunately, this analysis and AWDR data does not include pricing for the water though it does indicate, at least prior to the declared Colorado River shortfalls and allocated mandatory or compensated voluntary reductions, a significant and growing private market for the exchange of water rights within the state’s AMAs. (It remains to be seen how voluntary reductions will interact with the creation, exchange, and value of these credits, however.)
Subject to these considerations, the online Journal of Water posted regular updates on Type 2 Right and Storage Credit monetary exchanges in the Arizona AMAs between 2017 and 2019 when it appears the journal ceased publication. The journal found Type 2 Rights regularly traded for $1,500-$2,500/acre-foot while Storage Credits were valued at approximately $200/acre-foot with a high of up to $400 in the Phoenix AMA in 2018.[xli]
While these transfers are notable, the general character of the state’s legal water framework — particularly as it relates to groundwater, which is its largest single source by legal category — often inhibits the voluntary movement of water between users and across time based on information and pricing that is transparent and publicly available. In other words, the system does not meet the conditions for efficient markets.[xlii]
Central Arizona water augmentation options exist
While the ongoing drought and overallocation of some sources (“paper water”) have created water scarcity issues, augmentation and reallocation options exist. There are currently six AMAs in Arizona that both regulate groundwater use and monitor all water use by major users.
Of these six, three (Phoenix, Tucson, and Pinal) can plausibly be correlated with the geography, population, and economic activity of the state’s three largest counties (Maricopa, Pima, and Pinal). Maricopa County and the greater Phoenix area constitute both the state’s urban core and contain about two-thirds of its people and economy. CSI used these facts to draw general conclusions about overall state water use, the economic return on that water, and the viability of otherwise costly and politically controversial interventions to augment water supply within the state’s urban core.
Empowering Existing Water-Rights Holder to Reallocate
Figure 13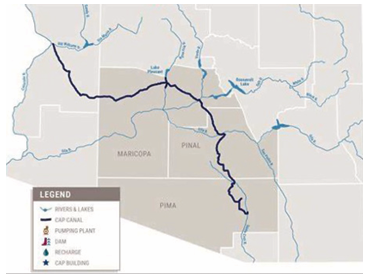
Thirteen of Arizona’s 16 counties are in rural areas. They contain 84% of the state’s land area, but less than one-quarter of its population. Much of this land is used for agricultural or ranching purposes. As such, these property-owners control much of the state’s water-rights.
Between two-thirds and three-fourths of the state’s water use is for agricultural purposes, depending on estimating source and methodology.
Over time, agriculture has become much more productive and water-efficient. In 1985, Arizona’s agricultural users consumed approximately 620,700 gallons per-capita, but today that number is 246,000 gallons. Meanwhile, since 1985 GDP per acre-foot in Arizona’s agricultural sector has increased nearly five-fold versus only about two-fold in all other sectors over the same period.
Figure 14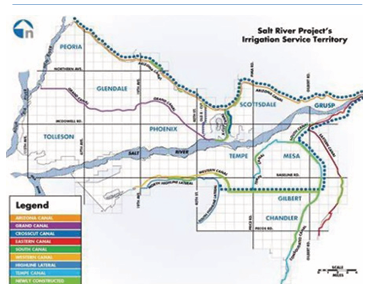
Furthermore, while CSI estimates that approximately 85% of the state’s population and economic activity reside within the three major AMAs (Maricopa, Pima and Pinal), they account for less than half of the state’s agricultural activity. In 1950, the equivalent figure was probably about half of state population and economic activity. In 1985, agriculture was 1.3% of state GDP; today it is 0.8%.
The implication? Most of the state’s water use, historically and today, has been for agricultural purposes, and agricultural activity has mostly occurred outside of the urban centers and AMAs where demand for water is greatest.
At the same time, the state is networked by more than 90,000 miles of natural river systems,[xliii] and nearly 500 miles of major canal systems[xliv] [xlv] that serve in part to bring rural surface water into central Arizona. These systems provide the infrastructural basis to move water around the state, given demand, means, and will.
In 2018, an investment firm sold water tied to farmland in Cibola, Ariz., a tiny agricultural community of only 250 full-time residents on the state’s western edge and along the Colorado River, to Queen Creek, a growing suburban community of 60,000 on the southeastern edge of the greater Phoenix metropolitan area. After a period of political controversy and litigation, Queen Creek agreed to pay a private landowner $24 million for an annual entitlement to 2,033 acre-feet of water, or approximately $11,800/acre-foot.[xlvi] On an annual basis, this sum could be the equivalent of $120 to $170 per-acre-foot-per-year in acquisition costs. (There may be other costs associated with the transport, treatment, and storage or use of water depending on circumstance, however.) As a younger player in Phoenix’s AMA, Queen Creek does not have an assured water supply and must secure new water sources to support new growth.[xlvii]
The Cibola-to-Queen-Creek deal is important because it moves water across a vast geographic area, approximately 200 miles, and crosses various political and jurisdictional boundaries. For example, Queen Creek is inside of the Phoenix AMA, but Cibola is not. Cibola is along the Colorado River while Queen Creek is not even though it does have access to the CAP canal.
The deal was facilitated by the voluntary retirement of legacy agricultural farmland when the associated water was determined to be more valuable when used on residential development in central Arizona. And, as part of the agreement, the fallowed farmland in Cibola was to be redeveloped for other local purposes, including growing and diversifying the community. That development probably could not have occurred without the financial injection provided by the water trade.
Political and legal structures that acknowledge and facilitate, rather than impede, these kinds of transactions can help manage Arizona’s ongoing transition and continued growth. Furthermore, the ensuing injection of money and capital into the rural sources can be used for local economic development, creating a win-win.
Rural possessors of increasingly valuable water should think of the asset as a tradable commodity with value pertinent to their long-term economic development. Small amounts of water reallocation from legacy rural use starting with the lowest-yielding water can have large urban impacts while protecting most rural and agricultural water. For example, to increase central Arizona water supplies by 300,000 acre-feet annually would require only about 7% of all water currently used by agriculture, or approximately 10% of all water used outside Maricopa County.
These experiences demonstrate that when private, voluntary exchange is allowed, everyone wins. Economic development occurs on both ends of the transaction. q
Allocate Existing Groundwater More Efficiently
In general, Arizona’s statutory framework governs the allocation of its groundwater, especially within the AMAs that encompass the state’s central valley and urban cores (Phoenix, Pinal, and Tucson). These frameworks generally prioritize existing users (grandfathered rights) and incentivize use-it-or-lose-it behavior (reasonable use doctrine).[xlviii] [xlix] [l]
This system is inefficient: marginal uses may be more efficient from a water-consumption perspective relative to legacy uses (e.g., the average use of existing water is agricultural; most new demand particularly in the state’s urban core is residential or, at least, not ag). Prohibiting new homebuilding in parts of rural Maricopa County, for example, may hurt rather than help the health of Phoenix AMA groundwater systems if the result is to slow the transition of legacy uses, often agricultural, to new uses (high-efficiency residential).[li]
The AMAs do provide some solutions that allow the exchange or sale of existing users’ groundwater rights to other users: Long Term Storage Credits[lii], Type 2 Non-Irrigation Rights[liii], and Extinguishment Credits,[liv] for example. These provisions impose strict limitations on owners that limit their value and viability, however, including limitations on where and how the purchased water right can be used. (For example, purchased Type 2 rights cannot be used for subdividing under the Assured Water Supply rules.) There are also issues differentiating between “wet” and “paper” rights in areas of possible oversubscription.
Despite these restrictions, a relatively robust market for traded water rights already exists in the state’s AMAs. This fact demonstrates markets’ viability even in the face of a highly-restrictive environment. Studies of the relative value of land in the Phoenix AMA with and without water rights also suggest that water both has value and that this value can be functionally marketed and traded.[lv]
Policies that clarify and enhance the existing ability of users to trade existing groundwater, without necessarily selling the land or extinguishing the legacy right, could improve the efficiency of groundwater use and help reduce dependence on Colorado River water in the central valley.
Acknowledge the Feasibility of New Sources
Sources to augment water supply exist. The CAP augmented Arizona’s water supply by transporting water from the peaks of the Rocky Mountains in the Upper River Basin. It did so via both natural and engineered infrastructure solutions.
Other external sources also exist. The Sea of Cortez, for example, is approximately 250 miles from central Phoenix. The salt content of ocean water can be treated at-scale with desalination. Indeed, Israel derives more than half of its total water supply from desalination plants.[lvi] Other nations also have successfully incorporated desalination plants into their water supplies, including Singapore, which uses highly-pure desalinated water for its municipal drinking supplies.[lvii] While existing studies suggest the cost of desalination is high, approximately $2,000/acre-foot,[lviii] costs may decline as the technology matures. Additionally, consumers may be more willing to pay if existing scarcity issues are not resolved.
Potable reuse that repurposes wastewater discharge for general municipal reuse is another option that has historically been cost-prohibitive. It should also become increasingly viable as scarcity issues inhibit the accessibility of existing sources for new users.[lix]
Establishing the feasibility of these sources without massive public subsidy and intervention, though, would require the creation of clear water property rights and effective statewide markets for exchange of those rights. Currently, such frameworks do not exist. As a result, large infrastructure projects require massive public investment and guaranteed purchase contracts, a problem that creates opportunities for political inefficiency.
The Return On Water Infrastructure Investment
As Figure 15 shows, solving Arizona’s water problems is essential for future growth.
Arizona, more than the average state, depends on the in-migration of people and capital from other places to support its growth. Ongoing demographic slowdowns will only increase this dependence in the future.
The ability to attract new residents is hindered by the current narrative about Arizona being out of water, however. In fact, according to anecdotal reports from some state homebuilders and home sellers, as well its business advocates, concerns about water supply make it harder to market in the state.[lx]
The Arizona Commerce Authority tracks the pipeline of expected investment in jobs and capital expenditures in Arizona by industry, including in manufacturing, data centers, research and develop, and other high-product sectors.[lxi] The potential future economic return on that pipeline is more than 500,000 jobs and $57 billion per year in new GDP. Together, CSI estimates this recruitment pipeline could provide $41 billion in new personal income, or more than $1,400 for every Arizonan.
The loss of some or even all this recruitment pipeline due to actual or perceived water issues clearly would harm the economy and its residents.
As Figure 16 shows, issues with water infrastructure also have impeded homebuilding. Indeed, in exurban Maricopa County the over-committed Colorado River has a homebuilding moratorium.
According to population, household formation, and homebuilding data from the U.S. Census Bureau, Buckeye and Queen Creek together add about 10,000 new people and 3,300 new households every year.[lxii] They are disproportionately impacted by the moratorium.[lxiii] Assuming the result of reduced homebuilding and higher home prices elsewhere reduces new Arizona household formation by approximately 3,000 units annually, the compounding impact of maintaining the moratorium for 10 years would be a loss of 18,600 jobs and $2 billion in GDP by 2035.
Solving the water availability issue could reduce dependence on the Colorado River, lift restrictions on new homebuilding, and protect future growth. For example, 300,000 acre-feet of rural water reallocated through market mechanisms and a legal framework that allows the free movement of water to Maricopa County could support the development of between 85,000 and 100,000 new urban housing units over the next decade. In contrast to the population, job, and economic losses of maintaining the moratorium, this augmentation policy could produce a net gain of 163,000 new residents, more than 43,000 jobs, and $10 billion in Arizona personal income — even after an assumed 7% reduction in the state’s agricultural economic output.
The Bottom Line
Political overallocation of the Colorado River a century ago is not a good reason to condemn all growth in Arizona.
While the recent drought has made conditions worse, central Arizona has always relied – to varying degrees – on imported water to meet its needs. For centuries, the challenge has been about engineering — building the infrastructure necessary to bring water from areas of plenty to areas of need. The last of these major projects, the Central Arizona Project canal, was finished nearly 40 years ago.
Recognizing the value of water and the possibility of delivering it efficiently and affordably can help resolve the current crisis on Lake Mead and in other parts of the state while boosting incomes, growth, and in-migration. It is time to build again.
Appendix A: Estimating Water Use And GDP
Good regional data on the state’s water consumption by source is not readily and reliably available over time. USGS produces statewide estimates, but the estimates are only available in five year increments and the latest data is from 2015. Extrapolating data is subject to potentially significant estimation error given their national scope and methodological assumptions.[lxiv]
The ADWR provides detailed information on withdrawals by most users within AMAs, but not all of the state is subject to an AMA. Additionally, the geography of an AMA itself is hydrologically determined — may have no or little direct correlation with traditional political boundaries for which demographic and economic data is otherwise available (e.g., county lines).
To resolve this issue, CSI reviewed the boundaries of Arizona’s six existing AMAs. Three of those appeared both large and central enough to plausibly be correlated with an underlying political boundary for which other data is readily available: Phoenix AMA (for which we proxied Maricopa County), Tucson AMA (proxied by Pima County), and Pinal AMA (proxied by Pinal County). Fortunately, these counties are also the state’s largest, contain its urban core, and envelop the central valley where the water need is manifest and not naturally available.
Reported water use by ADWR from all sources was divided by CSI between agricultural and all other uses. Other is assumed to contain residential, commercial, and industrial uses. CSI then assumed that water use data reported within these AMAs and over time was comprehensive, and correlated with the following demographic and economic measures:
· The size of the county/AMAs agricultural GDP as reported by the U.S. Bureau of Economic Analysis.
· The size of the county/AMAs other GDP as reported by the U.S. Bureau of Economic Analysis.
· Population in the county/AMA, as reported by the U.S. Census Bureau.
These correlations were then used to estimate total statewide water use and over time based on the share of the state’s total population, agricultural GDP, and other GDP occurring within these areas.
To analyze the dynamic economic impacts of these parameter value estimates, CSI utilized its Regional Economic Models, Inc. (REMI) Tax-PI model, a dynamic macroeconomic simulation that allows users to evaluate the impact over time of policy changes using input variables such housing construction, population and job growth, and capital investment.
[iv] While this is an admittedly unconventional way of presenting agricultural water use (which is, particularly over the last 50 years, largely independent of state population growth), this presentation allows an easy and apples-to-apples comparison of water use by sector controlling for total state growth.
[viii] “Commodity Costs and Returns”, U.S. Department of Agriculture. CSI assumed the yield-adjusted difference in relative land values for crop production in the Southwestern United States were plausibly attributable to availability of secured water rights.
[xv] “Phoenix”, 1911 Encyclopedia Brittanica, November 1, 1910.
[xxviii] Vandell, Perry, “The Salt River’s flowing. Thank open dam floodgates”, Arizona Republic, March 15th, 2023.
[xxxiv] Although average annual allocations of the Upper and Lower basins are agreed to be 15 million acre-feet, in practice it is possible for actual distributions of water in any year to exceed that limit. For example, the Compact limited Lower Basin distributions to 75 million acre-feet every ten years, meaning you can over-allocate in one year and make up for it later. The agreements are also unclear on how evaporation and other losses should be treated.
[xxxv] Staudenmaer, William, “Securing and Protecting Water Rights and Uses in Arizona”, Snell & Wilmer, 2022.
[xlv] “History of SRP canals”, Salt River Project, accessed on October 31st, 2024.
[liii] “Overview of the Arizona Groundwater Management Code”, Arizona Department of Water Resources, accessed on October 31st, 2024.
[lv] Yoo, James et. al., “The Value of Water Rights in Agricultural Properties in the Phoenix Active Management Area”, Arizona State University, 2012.