Key Findings
- Five municipalities within Boulder County, including Boulder, Longmont, Lafayette, Louisville and Erie, are actively weighing raising their minimum wage to the level of unincorporated parts of Boulder County or Denver.
- By 2030 Boulder County’s minimum wage of $25 would be 53% or $8.70 higher than the statewide rate of $16.30
- By 2030, Denver’s projected minimum wage of $20.68 would be 27% or $4.32 higher than the statewide rate of $16.30.
- By 2030, for every one person estimated to be drawn out of poverty from this policy, between 4 and 12 people would lose a job.
- For every person who loses a job, between 2.5 and 8 people would get paid more.
- Nearly 90% of jobs lost will be younger workers under the age of 25.
- Sectors that represent “main street” businesses face larger direct increases to both labor and operational costs.
- Restaurants face a 21% increase in labor costs and a 7% increase in operating costs, larger than the total average profit margin for a typical business.
- Grocery stores face a 13% increase in labor costs and a 1.6% increase in operating costs.
- Retail stores face a 7.6% increase in labor costs.
- Employment within the food accommodation sector in Boulder is already down 3% from 2019, the lowest among 12 of the state’s largest counties.
- Colorado’s recent investments in tax credits to support lower income workers and families means that a single parent making minimum wage and working 32 hours a week, would see an effective increase of $3.58/hour or $5,964 in total earnings after state and federal tax credits.
Long History of Minimum Wage Debate
Minimum wage policy is one of the most debated and researched economic policy topics. The first federal minimum wage went into effect in 1938 at 25 cents. It was last raised to $7.25 in 2009.
Colorado is one of 34 states to have enacted a state-specific minimum wage, which increased to $14.42 and $11.40 for tipped workers in 2024. In 2019, the Colorado General Assembly overturned a prior law which prevented local governments from enacting their own minimum wages. Since then, three municipalities have increased their minimum wage above the state level and several others have the policy under examination.
|
|
Min Wage
|
Min w/ Tipped Credit
|
|
State (if no higher local minimum)
|
$14.42
|
$11.40
|
|
Denver
|
$18.29
|
$15.27
|
|
Edgewater
|
$15.03
|
$12.00
|
Proponents of increasing the minimum wage argue it is an effective tool to raise the living standard of workers at the lowest incomes. However, much research and public debate has centered around the scale of unintended consequences.
The policy forces the cost of labor to increase, without some direct offsetting effect, thereby forcing businesses to respond in a number of ways including reducing employment levels, reducing hours, increasing automation and passing on the cost through higher prices.
Proponents inherently understand the tradeoffs and unintended consequences which is why policy changes are generally aimed at minimally increasing the wage floor above the current market clearing wage, rather than placing it at say $100 hour.
Boulder Minimum Wage Policy Debate and Tradeoffs
In late 2023 Boulder County Commissioners voted to increase the minimum wage of unincorporated parts of the county. This applies to all unincorporated municipalities as well such as Niwot, parts of Gunbarrel, Allenspark, Coal Creek Canyon, Eldora, Gold Hill, and Hygiene.
While the commissioners set the minimum wage to start lower than Denver’s, it will reach $25/hr by 2030, approximately 21% higher than Denver’s projected level of $21.60 under current inflation expectations.i After 2030, it will grow at the rate of inflation.
Several cities within the county including Boulder, Longmont, Lafayette, Louisville and Erie have been exploring the possibility of increasing their respective minimum wage. A report commissioned by those cities, produced by ECOnorthwest, laid out the significant tradeoffs they face.ii The Regional Minimum Wage Economic Analysis for Five Boulder County Municipalities report includes four scenarios to increase the city’s minimum wage.
- B1 – Move to Boulder County’s minimum wage as soon as possible
- B2 – Move to Boulder County's minimum wage by 2035
- D1 – Move to Denver’s minimum wage as soon as possible
- D2 – Move to Denver’s minimum wage by 2035
The faster each city attempts to increase their minimum wage, the larger the adverse impacts.
Employment Impacts
A 2021 National Bureau of Economic Research working paper, revised March 2022, summarized the results from the history of minimum wage research as followsiii:
- (i) there is a clear preponderance of negative estimates in the literature;
- (ii) this evidence is stronger for teens and young adults as well as the less-educated;
- (iii) the evidence from studies of directly-affected workers points even more strongly to negative employment effects; and
- (iv) the evidence from studies of low-wage industries is less one-sided.
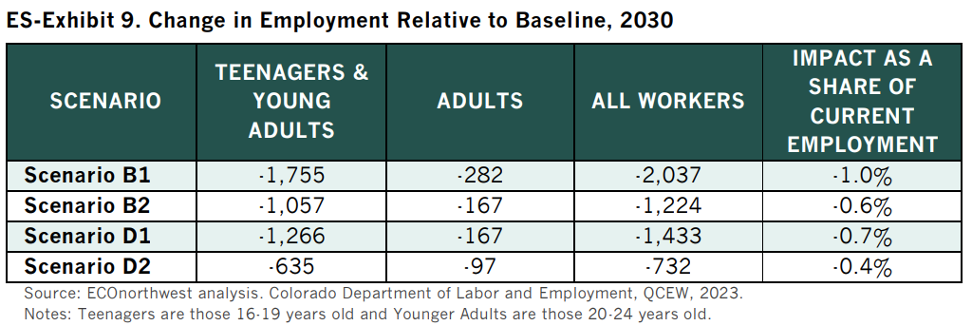
The regional minimum wage report supports this conclusion, estimating the following impacts across all 5 municipalities by 2030.
- Total employment losses across all 4 scenarios between -2,037(-1%) to -732(-.4%)
- Employment losses to younger workers make up 86% to 88% of all employment losses.
Despite being home to the University of Colorado, Boulder has the highest home prices in the state. Coupled with a minimum wage increase it would be even less accessible for younger Coloradans.
Figure 2
Reducing employment levels is just one option available to businesses to adjust to forced higher labor costs. Many will pass on the costs to consumers through higher prices or increase the use of automated technology to replace human labor. Though the regional minimum wage report does suggest the impact on the overall price level will be minimal, .09% by 2023 in the Boulder wage scenarios, it does not isolate the impact to prices in the most impacted sectors, such as restaurants and retail.
How Costs Stack Up Against Benefits
The regional minimum wage report concludes that between 15,805 or 8% of workers to 1,848 or 0.9% of workers will experience an increase in earnings because of measure by 2030. Generally, more than half are directly impacted and slightly less than half are indirectly impacted, meaning even though they have wages above the minimum wage, they see an increase in wage as a result of the policy.
- If the 5 municipalities were to move to Boulder County’s minimum wage, between 7.8 and 4.2 people would experience a wage increase for every job lost.
- If the 5 municipalities were to move to Denver’s minimum wage, between 4.9 and 2.5 people would experience a wage increase for every job lost.
The regional minimum wage report estimates that between 0 and 481 people would be removed from poverty by 2030. By 2035 it would be an estimated 987 to 522.
- For every person who is pulled from poverty by 2030, there would be between 11.9 and 4.2 fewer jobs.
Importantly, a large share of workers who will benefit from the policy are earning much more than the minimum wage. The report does not clarify the portion of workers that ‘only’ earn the minimum wage. For instance, bartenders and servers are a large share of workers in the restaurant industry who would benefit from an increase in the minimum wage. However, their total earnings are significantly higher given they earn tips.
Figure 3
|
Scenario
|
Boulder
|
Longmont
|
Lafayette
|
Louisville
|
Erie
|
|
B1
|
-6.2
|
-3.1
|
-3.1
|
-5.9
|
-1.3
|
|
B2
|
-17.4
|
-8.7
|
-8.6
|
-17.6
|
-3.6
|
|
D1
|
-12.5
|
-6.3
|
-6.2
|
-12.0
|
-2.6
|
Figure 4
|
Scenario
|
Boulder
|
Longmont
|
Lafayette
|
Louisville
|
Erie
|
|
B1
|
7.8
|
7.8
|
7.8
|
7.8
|
7.7
|
|
B2
|
4.2
|
4.2
|
4.2
|
4.2
|
4.1
|
|
D1
|
4.9
|
4.9
|
4.9
|
4.9
|
4.9
|
Industry Impacts
Estimates from the regional minimum wage report show a wide range of impacts to both payroll costs and operating costs across industries.
Impacts by 2035, across the 5 cities, under scenarios reaching Boulder County wage levels.
- Restaurants face a 21% increase in labor costs and a 7% increase in total operating costs.
- Grocery stores face a 13% increase in labor costs and a 1.6% increase in operating costs.
- Retail faces a 7.6% increase in labor costs.
- Hospitals only face a 1.1% increase in labor costs.
Figure 5
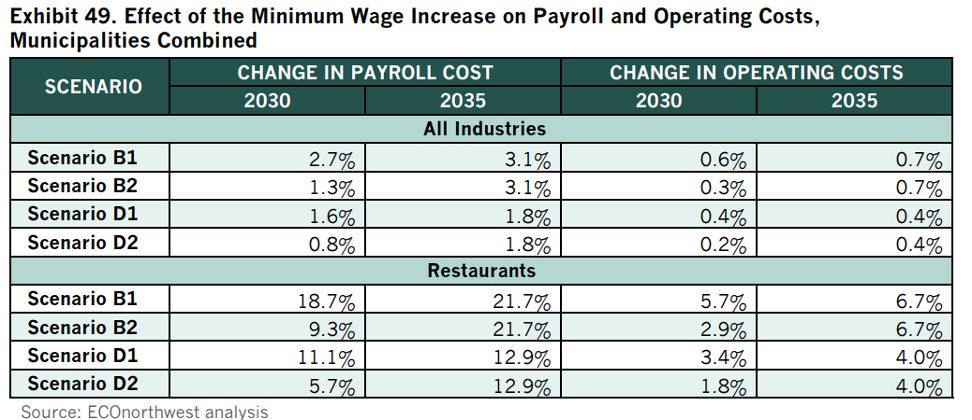
Though the report does not provide detailed employment impacts by sector, these operating costs provide a pretty good picture of where most employment will be lost. A 20% increase in labor costs for restaurants means that for every 5 people that could be hired without the minimum wage increase, only 4 could be hired after the wage increase.
|
Colorado
|
3%
|
|
Adams
|
8%
|
|
Arapahoe
|
1%
|
|
Boulder
|
-3%
|
|
Broomfield
|
-1%
|
|
Denver
|
-1%
|
|
Douglas
|
9%
|
|
El Paso
|
9%
|
|
Jefferson
|
1%
|
|
Larimer
|
1%
|
|
Mesa
|
6%
|
|
Pueblo
|
3%
|
If most restaurants have a margin between 3%-5%, the 7% increase in operating costs wipes out most restaurants’ entire profit, resulting in much greater pressure on price increases and employment reductions.iv
Since 2019, Boulder has already experienced the largest decline in employment in the food service industry. The lingering impacts of the pandemic have continued to plague many service-related business as both populations and business patterns have shifted. An increasing minimum wage would be a significant stressor on a sector already experiencing financial challenges.
Tax Credit Impacts on Earnings
In addition to minimum wage increases, lower-earning Coloradans, specifically single filers with young children, will experience significant income growth due to the expansion of Colorado’s tax credit system. Tamra Ryan, CSI’s Coors Economic Mobility Fellow, highlighted the expansion in her latest report showing that between 2021 and 2025, Colorado will have expanded its spending on the Earned Income Tax Credit (EITC) and combined child tax credits from $97 million to over $1.1 billion.v The investment signals a strong effort to boost the incomes of the most vulnerable low-wage workers in Colorado through means other than simply increasing wages.
Crucially, the expanded credit payments will have similar intended effects as wage increases without incurring the commonly stated economic issues that typically accompany minimum wage increases. Rather than squeezing businesses’ bottom line and possibly restricting their ability to hire and retain workers, the tax credit expansion provides targeted income growth to those who would otherwise be dependent on minimum wage increases alone.
As seen below, the growth of a full-time worker’s hourly wages for a single filer with a young child would be dramatic. For this person making Colorado’s minimum wage of $14.42, their hourly wage would increase by over 14%.
The results are even more profound for part-time (25 hours a week) workers. Given the tax credits are based on annual income, not hours worked, these tax credits represent a larger share of base wages for non-full-time employees. A single filer with one child under 6 making state minimum wage would see their hourly/yearly wages rise by over 33%.
A single filer with one child under working for the state’s minimum wage would earn $9,000 annually working just 12 hours a week. They would earn $30,000 working 40 hours. Just the combined benefit of the state and federal earned income and child tax credits would total $5,930, effectively increasing their hourly wage by $9.50 or 66%.
Figure 7
|
Hourly Income
|
Hours per year
|
Hours per Week
|
% of Full-Time
|
Yearly Income
|
State CTC, FATC, & EITC Tax Credits for Single Filer with 1 Child Under 6
|
Yearly Income + State Tax Credits
|
New Hourly Income
|
Hourly Wage Growth
|
Effective Hourly Increase
|
|
$14.42
|
624.1
|
12.0
|
30%
|
$9,000
|
$5,930
|
$14,930
|
$23.92
|
65.89%
|
$9.50
|
|
$14.42
|
1317.6
|
25.3
|
63%
|
$19,000
|
$6,287
|
$25,287
|
$19.19
|
33.09%
|
$4.77
|
|
$14.42
|
1664.4
|
32.0
|
80%
|
$24,000
|
$5,964
|
$29,964
|
$18.00
|
24.85%
|
$3.58
|
|
$14.42
|
2080.0
|
40.0
|
100%
|
$29,994
|
$4,411
|
$34,405
|
$16.54
|
14.71%
|
$2.12
|
Bottom Line
Policy analysis has made strides in recent years to more accurately depict the tradeoffs inherent with raising the minimum wage, such as job loss. Though Colorado has recently opened the door to local governments increasing their minimum wages beyond the state’s, the regional effects loom large. The faster each city attempts to increase their minimum wage, the faster adverse impacts will grow.