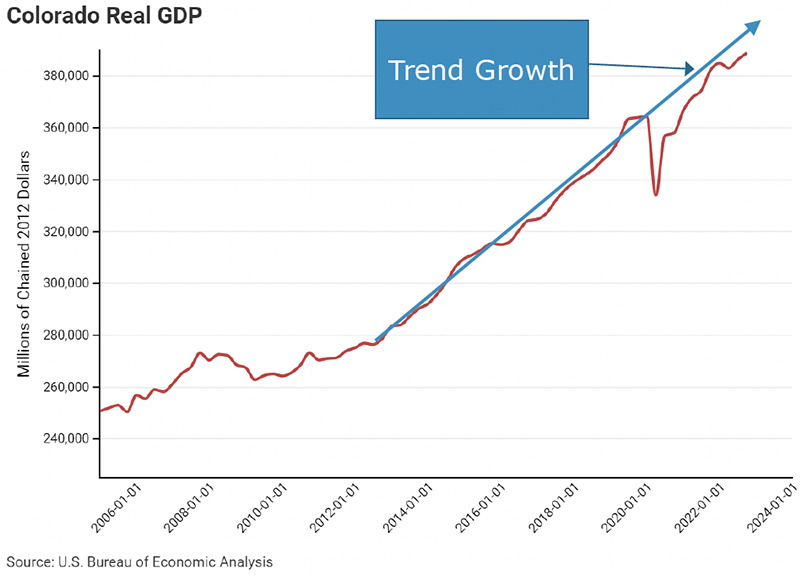
Real GDP
- GDP remains below trend growth following the COVID-19-induced recession.
- This drop in GDP could be attributed to several factors, including lasting structural COVID effects, or lower productivity associated with working from home.
Jobs
- May ‘22 to May ‘23 saw 1.05% job growth (3rd-lowest in US)
- Between 2012 and 2019, May to May job growth was, on average, 2.74%. However, the most recent period, May 22 to May 23 saw job growth of only 1.05%.
Since January 2020:
- Professional & Business Services Sector saw the most job growth (+45,700 jobs) and is equal to 58.14% of Colorado's total job growth.
- Mining & Logging down due to sharp decline in Oil & Gas sector output (loss of 5,000 jobs).
Labor Force
- Colorado's Labor Force Participation Rate (LFPR) is near its pre-pandemic level.
- 6 percent below the LFPR level in 2008.
- Possible explanations include aging workforce, declining male LFPR, transfer of wealth allowing for fewer workers.
Migration
- Colorado’s net migration has declined 80% over the last two years.
- The reduction in migration is estimated to have cost Colorado 14,000 potential jobs.
- Colorado ranked 3rd in net migration in 2015.
- In 2022, it ranked 18th.
Inflation
- In April & May 2023, the average CO household spent $2,160 more due to inflation—an average of $1,080 per month.
- Metro Denver inflation has outpaced the national average over the last 12 months—5.2% in Denver compared to 4.1% nationally.
Housing
- In the past 11 years, the cost (purchase price plus mortgage interest) of purchasing an average-priced home increased 112%. Most of the increase occurred in the last 3 years.
- The Denver Metro area needs to issue between 26,000 to 37,600 permits to close the housing deficit and meet new demand by 2028. Currently projected to issue 21,120 permits in 2023, well below the needed amount.
Crime
Since 2008:
- Colorado’s crime rate increased 28%.
- Colorado prison population decreased 29%.
- In 2022, the cost of crime in Colorado was nearly $30 billion.
Legislation & Crime
- Since 2010, the Colorado Legislature passed approximately 42 bills impacting sentencing, incarceration, parole, and length of stay:
- 14 bills reduced sentencing
- 7 increased sentencing
- 8 increased parole/probation
- 3 increased earned time
- Since the passage of HB14-1266, which made vehicle theft penalties dependent on the value of the stolen car, motor vehicle theft has risen 252%.
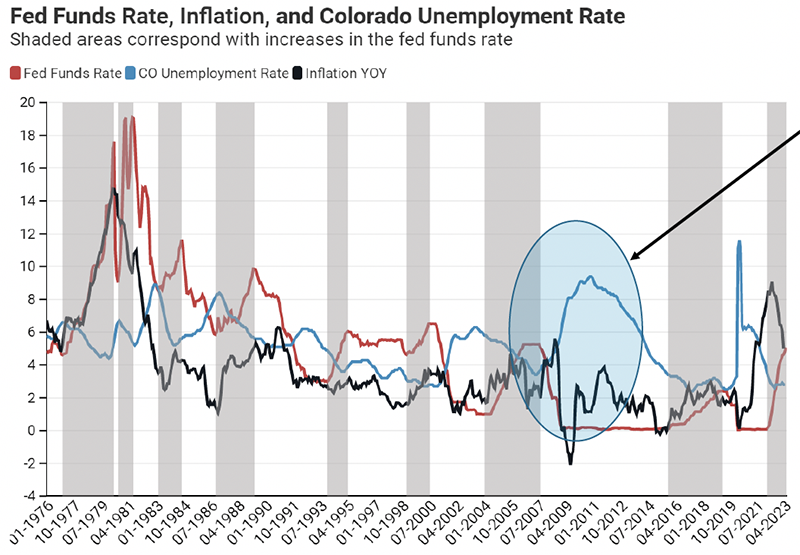
Biggest Unknown - Recession
The last time the Fed Funds Rate rose by 5 percentage points (from Jan 2004 to Aug 2007), the unemployment rate in Colorado increased by 5.9 percentage points.
If that repeats now, the statewide unemployment rate of 8.7% would mean there would be 274,000 unemployed Coloradans.