



September 1, 2026
Introduction
Public education is the largest single line in Iowa’s state budget. Kindergarten through grade 12 (K-12) spending alone accounts for roughly 52% of the state budget in FY 2027, or $4.8 billion.[i] Education also drives taxation and public spending at the local level. Iowa’s school districts collected over $3 billion in FY26, or 40% of all property-tax revenue statewide, more than any other local taxing authority.[ii] Personnel expenses constitute the single largest spending category within education. Salaries and benefits absorb roughly 82% of current K-12 expenditures.[iii] How districts allocate education funding matters, because not every dollar produces the same return.
Research finds instructional spending—the money that reaches teachers and the classroom—is tied directly to student achievement.[iv] Thus, the share of each dollar that reaches instruction shapes the return Iowa earns on its investment in public education. When non-teaching personnel headcounts grow faster than enrollment, the per-pupil cost of education rises without a proportional rise in the dollars deployed directly into the classroom. Indeed, for more than a decade researchers have documented a national “staffing surge” in which non-teaching employment has grown far faster than the students public schools serve.[v] According to Edunomics Lab, staffing across the United States grew 11.9% from school year 2014-15 to 2024-25 compared to a 2% decline of student enrollment.[vi] Viewed in light of the scholarship that connects instructional spending to student achievement, this trend means a diminishing return for kids with every new education dollar spent.
How Iowa school districts deploy capital—whether on classroom instruction or administration—also has a significant effect on the total cost of education. Because the average administrator earns nearly twice what the average teacher does, administrative headcount that outpaces enrollment and instructional staffing raises per-pupil costs without a corresponding classroom return. This is not to say administrative and support staff lack value. Rather, the relevant question is narrower, asking whether non-teaching staffing has grown in step with the students Iowa’s schools serve, and what any divergence costs. This report examines that question in three parts. It first establishes how Iowa’s education dollars are distributed across instruction and administration. Then it traces how the state’s student, teacher, and administrator counts have moved over the past decade. Finally, the report benchmarks Iowa against its Midwest peers to determine whether its trajectory reflects a national pattern or a divergence of Iowa’s own—and what that divergence costs taxpayers.
Key Findings
- Salaries and benefits absorbed 81.9% of Iowa’s total K-12 expenditures in 2023, the fifth-highest share in the nation, above the national average of 76.7% (figure 1).
- Iowa’s public school enrollment fell 2% between the 2014–15 and 2025–26 school years while administrator headcount rose 11.8% (figure 2).
- Teacher staffing tracked enrollment, holding the student-to-teacher ratio flat at 12.4 since 2020–21 (figure 2).
- Relative to Midwest peer states, Iowa lost fewer students, added fewer teachers, and added more administrators.
- Iowa’s administrator headcount grew 6.8% between the 2019–20 and 2024–25 school years, more than double the Midwest average of 3.2% (figure 4).
- Over the same timeframe Iowa’s student enrollment fell just 2.1% against a 3.7% regional decline. Its teacher headcount grew 0.6% against a regional 2.3%.
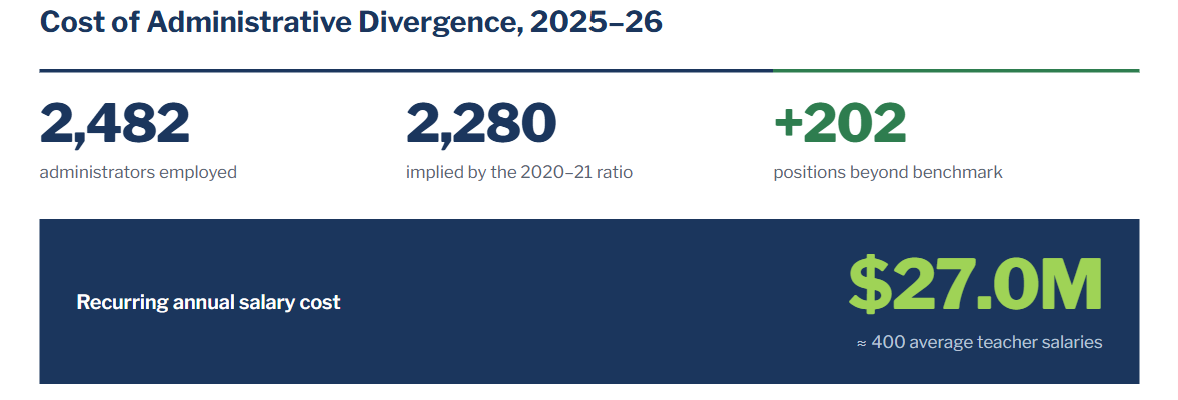
- Had administrative staffing in Iowa’s public school districts remained in line with student enrollment, Iowa would employ roughly 202 fewer administrators—an estimated $27.0 million in recurring annual salary spending statewide (table 1).
- On CSI’s Staffing-Enrollment Efficiency Index, Iowa’s administrators outpaced enrollment by 8.9 percentage points—a wider gap than every Midwestern state except Illinois, Kansas, Missouri, and Nebraska (table 2).
- Iowa’s administrator tandem score ranks 8th of 12 states.
- Iowa’s teacher’s tandem score ranks 6th of 12 states.
Salaries and Benefits Dominate Iowa’s K-12 Spending
Education is the single largest line item in Iowa’s state budget.[vii] Schools also consume the largest portion of property tax revenues than any other taxing authority at 40% in fiscal year 2025-26.[viii] Therefore, public education is one of the largest recurring costs borne by Iowa taxpayers. In Iowa, most education dollars are spent on personnel costs. Salaries and benefits absorbed 81.9% of total K-12 expenditures in 2023—the fifth-highest share in the nation and well above the national average of 76.7%.[ix] Nearly all personnel spending resides in two categories: instruction and support services. Together, these two account for 79.4% of Iowa’s total K-12 expenditures, also the fifth-highest share nationally.[x]
Figure 1 details Iowa’s 2024 state and local education spending from two perspectives. The left panel places Iowa in the national distribution of personnel spending as a share of total expenditures, disaggregated into instruction and support services. The right panel presents the same categories in per-pupil dollar terms. Instruction includes teachers and other staff who deliver classroom services. Support services makes up everything that surrounds the classroom, including general and school administration, student support, operations, and transportation.
Figure 1.
Source: U.S. Census Bureau
Iowa commits an above-average share of its budget to both instruction and support services. In 2024, 52.9% of total expenditures went to instructional salaries and benefits, 11th highest in the nation, while 26.5% went to support-services salaries and benefits, 13th highest. Measured in dollars rather than shares, however, Iowa is a below-average spender on both—$7,650 per pupil on instructional compensation and $3,834 on support-services compensation, against national averages of $9,057 and $4,432. Iowa’s schools, in other words, operate leaner budgets than most states, yet devote a larger fraction of those budgets to compensation. That combination of fewer total dollars, but more of them committed to compensation, leaves Iowa’s districts with little room to maneuver anywhere else.
Iowa spends such a larger share of its total education dollars on personnel that its education budget is effectively a personnel budget. Decisions about staffing carry more weight than any other spending choice districts make. Because personnel dollars are finite, instruction and support services compete for the same budget. Every percentage point of total spending committed to support-services compensation represents money unavailable for classroom compensation. When salaries command such a large share of total education spending, a single percentage point can represent tens of millions of dollars.
More than any other factor, the composition of a district’s workforce determines how much of each education dollar districts spend inside versus outside the classroom. The following subsections examine the trends within district composition through three major metrics: headcounts, staffing ratios, and salaries. Headcounts show whether staffing grew or contracted alongside the students a district services. Staffing ratios measure how intensively each staffing category changes against enrollment. Salaries translate any divergence between the two into dollars.
Education dollars should reach the classroom
Before turning to Iowa’s headcounts, it is worth establishing why the share of spending that reaches the classroom matters at all. Research shows that not all education dollars produce the same return. Instructional spending—the money that pays for teachers and the classroom itself—is one input tied to student achievement.[xi] A National Center for Education Statistics analysis of district spending found instructional expenditures associated with higher achievement, while several categories of spending outside the classroom showed no such link.[xii] More recent evidence points the same way.[xiii] Put simply, dollars that contribute to instruction do the work public education exists to do.
Dollars absorbed outside the classroom earn a weaker and less certain return. This is the concern researchers have raised about the national staffing surge referenced in this report’s introduction. Examining decades of rising non-teaching employment against enrollment and outcomes, analysts have questioned whether that growth delivered gains commensurate with its cost.[xiv] Administrative and support staff perform necessary functions, and no serious account of a school system would wish them away. But because education budgets are finite, every position added outside the classroom pulls from funds that could have otherwise gone toward instruction. Understanding where Iowa’s public education dollars flow, how those allocations have changed over time, and how Iowa compares with its regional neighbors can help inform decision makers as they seek to put K-12 funds to their most productive use.
Student, Teacher, and Administrative Count Trends in Iowa
As established in the introduction to this section, a school workforce that tracks its student body is the baseline expectation of an efficient system. As enrollment grows, staffing grows to serve it; as enrollment falls, staffing ought to adjust accordingly. The analysis in this subsection explores whether Iowa’s public schools have followed that pattern by tracking three series: the number of students Iowa’s public schools serve, the number of teachers who serve them, and the number of administrators who contribute to the system.[xv] Administrators are defined according to the Iowa Department of Education’s Condition of Education Report.[1] This section examines how each has evolved since the 2014–15 school year. Figure 2 presents cumulative growth in each of the three series, indexed to the 2014–15 school year, using data from the Iowa Department of Education’s annual Condition of Education reports.[xvi] If staffing tracked enrollment, all three lines would move roughly together.
Figure 2.
Source: Iowa Department of Education, Iowa Condition of Education Reports
The three headcounts have not moved in unison. Since the 2014–15 school year, public school enrollment in Iowa fell from 477,442 students to 467,935—a 2% decline. Enrollment grew modestly in the years before the COVID-19 pandemic, peaked in the 2019–20 school year, and has fallen every year since. Administrator headcount moved in the opposite direction, rising from 2,220 to 2,482 over the same period—an 11.8% increase. The divergence has widened sharply since the 2018–19 school year, the point at which administrator growth pulled away from both enrollment and teacher staffing.
Teacher headcount has followed a different trajectory. Teacher employment rose from 35,807 to 37,637 over the full period—a 5.1% increase. Since the pandemic, however, teacher staffing has declined 1.6%, roughly in step with falling enrollment, which declined 3.7% over the same period. Teacher staffing has adjusted to the post-pandemic enrollment decline, while administrator staffing has not. Raw headcounts, however, only tell part of the story.
Staffing ratios put both categories on common footing by measuring each against the students served. A district that adds administrators while enrollment grows is scaling with its student body. Adding administrators while enrollment falls means more administrators per student. Ratios distinguish between the two. Figure 3 tracks how staffing intensity has changed over time by translating the same data into two measures: students per teacher and students per administrator. The bars show each ratio’s level for each school year. The line traces its cumulative change since 2014–15.
Figure 3.
Source: Iowa Department of Education, Iowa Condition of Education Reports
Both ratios have fallen since the 2014–15 school year, but along very different paths. The student-to-teacher ratio declined from 13.3 students per teacher in 2014–15 to 12.4 in 2020–21—and has held at 12.4 in every year since. The decline for teachers stopped at the pandemic, when teacher staffing began to move in step with enrollment. The student-to-administrator ratio shows no such stabilization. After peaking at 217.7 students per administrator in 2017–18, it has fallen in every year since, reaching 188.5 in 2025–26. Put differently, the ratio saw a 12.3% decline from 2014–15, with the drop accelerating after 2018–19. Each administrator now corresponds to roughly 27 fewer students than a decade ago, and the gap continues to widen.
The two ratios also carry different meanings. A falling student-to-teacher ratio reflects staffing concentrated in the classroom, and its post-2020 plateau shows districts adjusting teacher headcount as enrollment fell. A falling student-to-administrator ratio reflects the opposite pattern. Administrative staffing has grown more intensively relative to the students served. Administrators as a share of total district staff rose 20.0% over the period, and unlike the teacher ratio, the administrator ratio shows no sign of leveling off.
Put simply, as Iowa’s public schools shed students, districts reduce the teacher count but keep adding administrators.
However, ratios describe the shape of the divergence but not its price. Each staffing position a district carries beyond what enrollment would support represents excess recurring salary spending. The following subsection puts a dollar figure on that gap.
Administrative Divergence Carries a Recurring Annual Cost
The teacher ratio’s post-2020 plateau offers a benchmark for what disciplined staffing looks like when enrollment falls. From the 2020–21 school year onward, Iowa’s districts held the student-to-teacher ratio flat at 12.4, allowing teacher headcount to drift downward in step with declining enrollment. Applying that same standard to administrators isolates the fiscal cost of the divergence. In this section, CSI estimates what Iowa would spend on administrative salaries today had administrative intensity held at its post-pandemic level rather than continuing to climb.
In 2020–21, Iowa’s public schools employed roughly one administrator for every 205 students. Had that ratio held, as the teacher ratio did, the 2025–26 enrollment of 467,935 students would call for about 2,280 administrators. Districts instead employ 2,482, or one administrator for every 188 students. The difference amounts to roughly 202 administrative positions carried on payroll beyond what a flat post-pandemic staffing standard would require. Table 1 outlines the economic consequences of this divergence.
Table 1.
Source: Iowa Department of Education, CSI Calculations
Note: Assumes a weighted-average administrative salary of $133,740
At the 2025–26 weighted-average administrator salary of $133,740, those 202 positions account for approximately $27.0 million in annual salary spending that a flat administrative ratio would not have generated.[xvii] The scale is easier to grasp in classroom terms. The average Iowa administrator earns nearly twice the average teacher, whose 2025–26 salary averaged $67,039. Therefore, $27.0 million is equivalent to roughly 400 teacher salaries directed toward administrative growth that did not correspond to changes in student enrollment. Because base salaries recur rather than lapse, the figure is not a one-time outlay. This gap compounds with every year the divergence persists. Nothing in this calculation should be construed to suggest that any individual administrative position is unnecessary. The estimate measures administrative intensity against a counterfactual, not the value of the work performed.
Whether a divergence of that size reflects choices specific to Iowa or pressures common to every public school system requires a wider lens. The next section benchmarks Iowa’s staffing trends against its Midwest peers since the 2019–20 school year to assess whether administrator growth outpacing enrollment is an Iowa story or a regional one.
Iowa’s Administrative Growth Outpaces Its Midwest Peers
The trends documented in the previous section raise a natural question: is the phenomenon of administrative growth amid enrollment decline unique to Iowa, or is it a common trend throughout the Midwest region? If every state in the region added administrators at Iowa’s pace, the pattern would point to forces common to all public school systems, such as federal mandates, post-pandemic staffing decisions, or shared demographic pressures. If Iowa instead outpaces its neighbors, the divergence reflects choices specific to Iowa. This section compares changes in administrator, teacher, and student headcounts across the 12 Midwestern states between the 2019–20 and 2024–25 school years. Comparisons run through 2024–25 rather than 2025–26 because several states have not yet released their most recent figures. For that reason, Iowa’s numbers here differ slightly from the 2025–26 endpoints reported earlier. Figure 4 compares Iowa against the average of the 11 other Midwest states across all three headcounts.
Figure 4.
Source: Iowa Department of Education, Illinois Report Card, Indiana Department of Education, Kansas Data Central Reports, Michigan School Data, Minnesota Department of Education, Minnesota Report Card, Nebraska Department of Education, North Dakota Education Insights, Ohio Report Card, South Dakota Department of Education, Wisconsin Report Card
While most Midwest states have seen administrative growth outpace student enrollment, Iowa stands out for its above average divergence between the two. Across the Midwest, administrator headcount rose 3.2% on average between the 2019–20 and 2024–25 school years, even as student enrollment fell 3.7%. Iowa’s administrator headcount grew considerably faster at 6.8%, well above the regional average. It did so while enrollment fell just 2.1%, less than half the regional decline. Teacher staffing ran the other way. Iowa’s teacher headcount grew 0.6% over the window, below the Midwest average of 2.3%. Relative to its peers, then, Iowa lost fewer students, added fewer teachers, and added more administrators. Figure 5 ranks all 12 Midwestern states on each of the three measures, showing where Iowa falls in the regional distribution.
Figure 5.
Source: State departments of education and public-school report cards for the 12 Midwestern states
Administrative expansion was nearly universal across the region. Only Indiana and Michigan reduced administrator staffing over the period, while Nebraska and North Dakota posted the largest increases, at roughly 10% each. Iowa’s 6.8% administrative growth ranked sixth highest among the 12 states. Enrollment moved in the opposite direction across most of the region—only North Dakota, South Dakota, and Nebraska gained students. Iowa’s 2.1% enrollment decline was among the region’s mildest declines, with only three states posting a smaller drop. On teacher staffing, Iowa’s 0.6% growth fell in the bottom half of the region, coming in at eighth highest. How administrator and teacher staffing moved relative to the number of students each state served, however, matters more than the headcount ranking shown in figure 5.
To capture this datapoint, CSI constructed a Staffing-Enrollment Efficiency Index, presented in table 2. For each state, the index measures the gap between staffing growth and enrollment growth over the 2019–20 to 2024–25 window, separating administrators and teachers. It then converts each gap into a tandem score where 100 marks staffing that moved exactly in step with enrollment. A score below 100 means the category grew heavier than its student body, while a score above 100 means it ran leaner. Averaging the administrator and teacher scores yields an overall efficiency score, and the 12 states are ranked by how far that score sits from 100 in either direction. The smaller the gap, the more tightly staffing tracked enrollment. A score near 100 describes a workforce that grew or contracted roughly in line with its student body. The further a score drifts from 100, the more staffing pulled away from the students it serves—with the direction of the drift showing whether the state added staff faster than enrollment or shed it faster.
Table 2.
Source: State departments of education and public-school report cards for the 12 Midwestern states
Note: Positive “gap” values indicate the respective staffing unit outpaced student enrollment growth. This value is presented in as a difference in percentage points.
By the combined measure, Iowa ranks 6th of the 12 Midwestern states, with an efficiency score of 94.4. This is close to the regional middle, but under the 100 mark that signals staffing moving in step with enrollment. That placement, though, rests almost entirely on the teacher side of the index. Iowa’s teacher tandem score of 97.3 sits closer to perfect tandem, reflecting a teaching workforce that grew nearly in step with enrollment. On this measure, Iowa ranks 6th. Iowa’s administrator tandem score is lower, at 91.1. This administrator side of the score pulls Iowa away from the region’s leaders, ranking Iowa 8th. Measured as a gap, Iowa’s administrators outgrew its students by 8.9 percentage points over the window, a wider margin than every Midwestern state except Illinois, Kansas, Missouri, and Nebraska.
Administrative expansion is a region-wide pattern, and Iowa’s experience is not unique in direction. Where Iowa stands apart is the combination. Iowa lost students slowly (-2.1%, versus -3.7% for the rest of the Midwest) and added teachers slowly (+0.6%, versus +2.3% regionally). On both classroom measures it moved less than its neighbors. On administrators, Iowa moved the other way, expanding by 6.8%—more than double the regional pace of 3.2%—among the fastest growth in the Midwest. This divergence on the administrative side distinguishes Iowa within the region.
Bottom Line
Iowa’s public schools now serve fewer students than they did a decade ago while employing more administrators to oversee them, and the gap shows no sign of closing. Student enrollment declined after the pandemic. Teacher staffing adjusted to reflect the new headcounts, but administrative staffing increased. This gap has fiscal consequences. It determines how much less of each taxpayer dollar directly reaches the classroom. Administrative staffing has pulled away from enrollment every year since 2018-19. Because base salaries recur, each year the divergence between administrators and student enrollment persists adds roughly $27 million in education spending.
This phenomenon is not unique to Iowa in direction, but Iowa has gone further than most of its neighbors. The data show above-average administrative growth. Like most other Midwestern states, Iowa added both teachers and administrators while shedding students. But Iowa stands out in that it added relatively few teachers while adding disproportionately more administrators. Bringing administrator staff count in line with enrollment could improve the productive use of every education dollar deployed while reducing total education spending.
Appendix
Figure 6.
Source: State departments of education and public-school report cards for the 12 Midwestern states
Endnotes
[1] The Iowa Department of Education lists administrator types as “AEA Chief Administrator, AEA RegionalZone Coordinator, Assistant Principal, Assistant Superintendent, Dean of Students, Other Administrator, Principal, Special Education Director, Superintendent, and Supervisor – Licensed.”
[i] Andrzej Wieciorkowski, “The Iowa Budget Then and Now – FY27,” Common Sense Institute Iowa, June 30, 2026, https://www.commonsenseinstituteus.org/iowa/research/state-budget/the-iowa-budget-then-and-now-fy27.
[ii] Iowa Department of Management, “Property Taxes by Type of Taxing Authority,” State of Iowa, Accessed July 2026, https://dom.iowa.gov/local-government/property-tax-tax-replacement.
[iii] United States Census Bureau, “Annual Survey of School System Finances Tables,” United States Department of Commerce, Accessed July 2026, https://www.census.gov/programs-surveys/school-finances/data/tables.html.
[iv] Benjamin Scafidi, Ph.D., “Back to the Staffing Surge,” EdChoice, May 2017, https://www.edchoice.org/wp-content/uploads/2017/05/Back-to-the-Staffing-Surge-by-Ben-Scafidi.pdf; Adam Schuster, “Classroom First: District Consolidation Can Improve Illinois’ Education Outcomes While Saving Taxpayers Money,” Illinois Policy, August 24, 2021, https://www.illinoispolicy.org/reports/classrooms-first-district-consolidation-can-improve-illinois-education-outcomes-while-saving-taxpayers-money/; National Center for Education Statistics, “Does Money Matter? School District Expenditures, School Resources and Student Achievement,” NCES 98-212, 1997, https://nces.ed.gov/pubs98/dev97/98212h.asp; Chester E. Finn Jr., “The Hidden Half: School Employees Who Don’t Teach,” Education Next, August 15, 2014, https://www.educationnext.org/hidden-half-school-employees-dont-teach/.
[v] Benjamin Scafidi, Ph.D., “Back to the Staffing Surge,” EdChoice, May 2017, https://www.edchoice.org/wp-content/uploads/2017/05/Back-to-the-Staffing-Surge-by-Ben-Scafidi.pdf; Aaron Garth Smith, Christian Barnard, and Jordan Campbell, “Public education at a crossroads: A comprehensive look at K-12 resources and outcomes,” Reason Foundation, February 29, 2024, https://reason.org/k12-ed-spending/crossroads-report/; Ira Stoll, “Growth in Administrative Staff, Assistant Principals Far Outpaces Teacher Hiring,” Education Next, October 1, 2020, https://www.educationnext.org/growth-administrative-staff-assistant-principals-far-outpaces-teacher-hiring/.
[vi] “Staffing & Enrollment Trends,” Edunomics Lab, Accessed July 2026, https://edunomicslab.org/staffing-v-enrollment-trends/
[vii] Andrzej Wieciorkowski, “The Iowa Budget Then and Now – FY27,” Common Sense Institute Iowa, June 30, 2026, https://www.commonsenseinstituteus.org/iowa/research/state-budget/the-iowa-budget-then-and-now-fy27.
[viii] Iowa Department of Management, “Property Taxes by Type of Taxing Authority,” State of Iowa, Accessed August 2026, https://dom.iowa.gov/local-government/property-tax-tax-replacement.
[ix] United States Census Bureau, “Annual Survey of School System Finances Tables,” United States Department of Commerce, Accessed July 2026, https://www.census.gov/programs-surveys/school-finances/data/tables.html.
[x] United States Census Bureau, “Annual Survey of School System Finances Tables,” United States Department of Commerce, Accessed July 2026, https://www.census.gov/programs-surveys/school-finances/data/tables.html.
[xi] Adam Schuster, “Classroom First: District Consolidation Can Improve Illinois’ Education Outcomes While Saving Taxpayers Money,” Illinois Policy, August 24, 2021, https://www.illinoispolicy.org/reports/classrooms-first-district-consolidation-can-improve-illinois-education-outcomes-while-saving-taxpayers-money/.
[xii] National Center for Education Statistics, “Does Money Matter? School District Expenditures, School Resources and Student Achievement,” NCES 98-212, 1997, https://nces.ed.gov/pubs98/dev97/98212h.asp.
[xiii] Benjamin Scafidi, Ph.D., “Back to the Staffing Surge,” EdChoice, May 2017, https://www.edchoice.org/wp-content/uploads/2017/05/Back-to-the-Staffing-Surge-by-Ben-Scafidi.pdf; Chester E. Finn Jr., “The Hidden Half: School Employees Who Don’t Teach,” Education Next, August 15, 2014, https://www.educationnext.org/hidden-half-school-employees-dont-teach/.
[xiv] Benjamin Scafidi, Ph.D., “Back to the Staffing Surge,” EdChoice, May 2017, https://www.edchoice.org/wp-content/uploads/2017/05/Back-to-the-Staffing-Surge-by-Ben-Scafidi.pdf; Aaron Garth Smith, Christian Barnard, and Jordan Campbell, “Public education at a crossroads: A comprehensive look at K-12 resources and outcomes,” Reason Foundation, February 29, 2024, https://reason.org/k12-ed-spending/.
[xv] Iowa Department of Education, “2025 Condition of Education Report – Staff Characteristics by Group, Position, District,” State of Iowa, Accessed July 2026, https://reports.educateiowa.gov/COE/home/staffPositionsByDistrict?Length=4.
[xvi] Iowa Department of Education, “2025 Condition of Education Report – Staff Characteristics by Group, Position, District,” State of Iowa, Accessed July 2026, https://reports.educateiowa.gov/COE/home/staffPositionsByDistrict?Length=4.
[xvii] Iowa Department of Education, “Staff Data (Salaries),” State of Iowa, Accessed July 2026, https://educate.iowa.gov/pk-12/data/education-statistics.