


October 28, 2026
Experts:
Colorado’s Hot Housing Market May be Cooling
Key Findings
Colorado Springs and Denver lead the nation’s large housing markets in listing price cuts.
- Among U.S. metro areas with at least 5,000 listings, Colorado Springs has the highest share with a price cut at 55.7%, followed by Denver at 55.0%.
- Those shares substantially exceed Boston’s 32.3%, San Francisco’s 29.5%, and New York’s 27.7%.
Price cuts extend well beyond Denver and Colorado Springs.
- More than 40% of listings have undergone price cuts in 15 Colorado markets, spanning the Front Range, Western Slope, and mountain communities.
- Shares reach 53.7% in Greeley, 52.4% in Grand Junction, 51.2% in Pueblo, and 48.7% in Breckenridge.
Declining home values could reduce household wealth by billions of dollars.
- Using listing-price cuts as a proxy for changes in home values, CSI estimates a potential $35.4 billion decline in housing wealth across seven Colorado markets.
- Denver and Colorado Springs account for an estimated $21.2 billion and $4.7 billion, respectively—roughly three-quarters of the total.
Falling home prices would have different consequences for prospective buyers and existing homeowners.
- Lower purchase prices could make homeownership more accessible, while declining market values would reduce existing homeowners’ equity even if they do not sell.
The Backdrop: Home Values by City/Metro Area
The median list price of a home in the United States was $419,250 in September 2026.[i] The median U.S. sales price was $376,000 in the same month.[ii]
In many Colorado cities, values are much higher. Based on the most recent figures in October 2026, the median value of a home in:
High home values mean different things to different people based on their place in the market. An owner who purchased their home 20 years ago has enormous built-up equity. Eroding equity would be cause for concern, particularly if that owner was hoping their home could help fund retirement or some other venture. Meanwhile, high home values have made it difficult for many residents to achieve their dream of homeownership. For a person trying to purchase a home, a drop in value could be a welcome change.
This report makes no judgement on whether falling home prices are a positive or negative development for Colorado residents—it merely provides insight into what the future may hold for home prices and household wealth.
Median Single Family Home Value by Metro Area
Home values, and the wealth they can convey, not only vary widely across the country, but across Colorado as well. As Figure 1 shows, values in Pueblo are less than half of what they are in Boulder, for example. Grand Junction and Colorado Springs fall somewhere in the middle of the value range.
Different data sources also offer different estimates.
In Pueblo, the median home value ranges from $283,419 as measured by Zillow to $305,041 as measured by Parcl Labs. In Boulder, the range is wider: $712,024 (Zillow) to $760,456 (Parcl Labs).
cross the seven markets studied, a 1% change in home values represents approximately $8.8 billion in housing wealth.
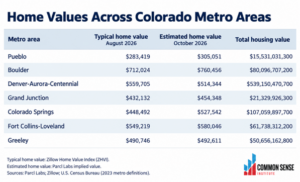
Figure 1: Typical Home Value and Total Value of the Market for Each MSA
Share of Listings with a Price Cut
Price cuts for listed homes provide a warning sign about changes in the economy and potential housing wealth erosion.[v],[vi] Homeowner wealth is closely connected to what consumers are willing to pay for a property.[vii] When owners list a home, they want to sell at the highest price they can get.[viii] When homes fail to attract buyers at the original asking price, sellers resort to price cuts.[ix] When price cuts become widespread, they can signal downward pressure on home values. Price reductions alone do not establish a loss of wealth, but when pressure leads to declining market values, homeowners lose equity even if they do not sell. Price cuts are a normal part of housing market transactions. They occur even when the housing market is rising quickly in value. The current breadth of the price cuts, though, is not normal for a state with enormous built-up wealth in housing.
Where is this potential loss in homeowner wealth most visible in Colorado right now? Based on Parcl Labs data, in Boulder, Breckenridge, Canon City, Colorado Springs, Denver, Durango, Edwards, Fort Collins, Fort Morgan, Grand Junction, Greeley, Montrose, Pueblo, Sterling, and Steamboat Springs more than 40% of listings have undergone price cuts.
As Figure 2 shows, of U.S. metro areas with 5,000 or more listings, Colorado Springs leads the nation in the share of listings (55.7%) that have required a price cut. With 55% of listings needing a price cut, Denver ranks second among all U.S. metro areas. (Appendix A and Appendix B have a fuller set of data and, as Appendix B shows, the need for price cuts is widespread across Colorado communities.)
In cities like Boston, New York, and San Francisco, the percentage of homes requiring price reductions was significantly lower, ranging from about 27% to 33%.
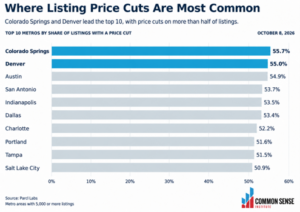
Figure 2: MSAs with the highest share of price cuts among listed properties
Declining Home Values and Household Wealth
Given the wide scope of housing price cuts in Colorado, it is likely residents who own homes are losing wealth.
Using the typical listing price cut (3%) and presuming the listing price cuts are a rough proxy for the value of homes (and thus value lost), CSI estimates household wealth in the seven markets covered by this study is down by about $36 billion since 2024 through year-to-date 2026. The majority of that decline, $26 billion, comes from Colorado Springs and the Denver-Aurora-Centennial metro areas alone.
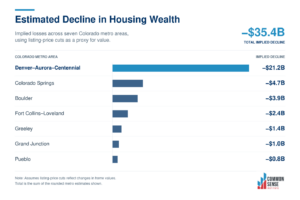
Figure 3: The Loss in Wealth Across Seven Areas If Listing Price Cuts Are Indicative of Value
Bottom Line
In October 2026, the Colorado Association of Realtors said, “Colorado’s housing market continued to lose momentum in September as declining sales, cautious buyers, and affordability challenges created growing pressure on sellers.”[x]
This report shows the state’s once-hot housing market is cooling considerably. The number of home listings requiring a price cut is much higher than in other areas of the country. Whether that fact is a positive or negative development is in the eye of the beholder. What is certain is that the shift could have implications for the state’s economy.
Appendix A: Share of Listings with a Listing Price Cut for Metros with 5,000 or More Listings
| Name | % Listings with Price Cuts | Total Listings |
| Colorado Springs | 55.7% | 5,509 |
| Denver | 55.0% | 17,574 |
| Austin | 54.9% | 16,742 |
| San Antonio | 53.7% | 19,163 |
| Indianapolis | 53.5% | 10,336 |
| Dallas | 53.4% | 41,846 |
| Charlotte | 52.2% | 15,537 |
| Portland | 51.6% | 12,364 |
| Tampa | 51.5% | 26,587 |
| Salt Lake City | 50.9% | 5,385 |
| Greenville | 50.1% | 5,529 |
| Raleigh | 50.1% | 8,692 |
| Des Moines | 49.6% | 5,035 |
| Jacksonville | 49.3% | 11,946 |
| Phoenix | 48.7% | 28,431 |
| Deltona | 48.7% | 8,237 |
| Charleston | 48.5% | 5,832 |
| Columbus | 48.4% | 7,799 |
| Oklahoma City | 48.1% | 8,197 |
| Seattle | 47.9% | 16,488 |
| Orlando | 47.9% | 19,657 |
| Memphis | 47.5% | 6,582 |
| Palm Bay | 47.0% | 5,470 |
| Myrtle Beach | 46.8% | 12,122 |
| Lakeland | 46.4% | 8,183 |
| Pittsburgh | 46.2% | 7,447 |
| Atlanta | 45.9% | 33,508 |
| Tucson | 45.8% | 5,935 |
| Knoxville | 45.8% | 5,230 |
| North Port | 45.7% | 11,780 |
| New Orleans | 45.5% | 7,728 |
| Birmingham | 44.8% | 5,700 |
| Port St. Lucie | 44.6% | 5,771 |
| Las Vegas | 44.4% | 14,264 |
| Houston | 44.0% | 46,078 |
| Cape Coral | 43.8% | 13,147 |
| Louisville | 43.8% | 5,728 |
| Baltimore | 43.1% | 10,141 |
| Sacramento | 42.8% | 8,394 |
| Cincinnati | 42.5% | 7,259 |
| Nashville | 42.2% | 14,649 |
| Minneapolis | 41.7% | 14,559 |
| Cleveland | 40.8% | 6,805 |
| Virginia Beach | 40.7% | 5,747 |
| St. Louis | 40.4% | 10,390 |
| DC | 39.9% | 21,813 |
| Detroit | 39.0% | 17,426 |
| San Diego | 38.6% | 8,489 |
| Miami | 38.5% | 51,940 |
| Philadelphia | 38.4% | 21,314 |
| Kansas City | 38.2% | 9,526 |
| Riverside | 38.1% | 19,510 |
| Naples | 37.6% | 6,035 |
| Los Angeles | 36.0% | 30,016 |
| Boston | 32.3% | 17,374 |
| Chicago | 29.8% | 23,774 |
| Buffalo | 29.7% | 5,214 |
| San Francisco | 29.5% | 8,733 |
| Providence | 28.5% | 5,426 |
| New York | 27.7% | 53,412 |
Table 1: Share of Listings with a Price Cut for Metros with 5,000 or more Listings
Appendix B: Share of Listings with a Listing Price Cut for All Tracked Metros
| MSA | % Listings with Price Cuts | Total Listings |
| Worthington | 61.1% | 72 |
| Price | 59.0% | 134 |
| Shelton | 58.5% | 487 |
| Albemarle | 58.1% | 344 |
| Klamath Falls | 57.9% | 632 |
| Laurinburg | 57.9% | 140 |
| Hereford | 57.1% | 63 |
| Aberdeen | 56.9% | 819 |
| Bonham | 56.9% | 348 |
| Bend | 56.5% | 2,137 |
| Brookings | 56.4% | 388 |
| Walla Walla | 56.2% | 413 |
| Prineville | 56.0% | 368 |
| Greeneville | 55.8% | 387 |
| Colorado Springs | 55.7% | 5,509 |
| Coos Bay | 55.5% | 546 |
| Port Angeles | 55.4% | 518 |
| Maryville | 55.1% | 78 |
| Denver | 55.0% | 17,574 |
| Austin | 54.9% | 16,742 |
| Shelby | 54.6% | 526 |
| Granbury | 54.5% | 931 |
| Johnson City | 54.5% | 966 |
| Brenham | 54.4% | 294 |
| Newport | 54.3% | 833 |
| Forest City | 54.2% | 524 |
| Newport | 54.0% | 248 |
| Grants Pass | 54.0% | 657 |
| Lawrenceburg | 54.0% | 237 |
| Kingsport | 53.9% | 1,747 |
| Big Rapids | 53.8% | 253 |
| San Antonio | 53.7% | 19,163 |
| Greeley | 53.7% | 2,374 |
| Asheville | 53.7% | 4,150 |
| Bedford | 53.5% | 273 |
| Indianapolis | 53.5% | 10,336 |
| Centralia | 53.4% | 599 |
| Sanford | 53.4% | 365 |
| Borger | 53.4% | 88 |
| Houghton | 53.4% | 221 |
| Dallas | 53.4% | 41,846 |
| Minden | 53.3% | 122 |
| Brownsville | 53.3% | 77 |
| Peru | 53.2% | 124 |
| Macomb | 53.1% | 145 |
| Sonora | 53.1% | 586 |
| Ogden | 53.0% | 3,204 |
| Lock Haven | 52.9% | 138 |
| Pella | 52.8% | 142 |
| Sherman | 52.8% | 1,761 |
| Roseburg | 52.8% | 758 |
| Seneca | 52.7% | 554 |
| Big Stone Gap | 52.6% | 152 |
| Olympia | 52.6% | 1,540 |
| Bangor | 52.6% | 873 |
| Mount Vernon | 52.6% | 702 |
| Salem | 52.5% | 2,176 |
| Longview | 52.4% | 622 |
| Grand Junction | 52.4% | 1,351 |
| Albany | 52.3% | 645 |
| Charlotte | 52.2% | 15,537 |
| Crossville | 52.1% | 780 |
| Moscow | 52.0% | 148 |
| Cordele | 52.0% | 100 |
| Florence | 52.0% | 895 |
| Portland | 51.6% | 12,364 |
| Tampa | 51.5% | 26,587 |
| Lamesa | 51.4% | 35 |
| Medford | 51.4% | 1,475 |
| Hickory | 51.3% | 2,047 |
| Mcminnville | 51.3% | 234 |
| Palatka | 51.3% | 593 |
| Pueblo | 51.2% | 1,212 |
| Plattsburgh | 51.1% | 362 |
| Mexico | 51.0% | 98 |
| Clearlake | 51.0% | 673 |
| Jasper | 50.9% | 265 |
| Salt Lake City | 50.9% | 5,385 |
| Mount Airy | 50.9% | 273 |
| Savannah | 50.9% | 3,192 |
| Lafayette | 50.9% | 776 |
| El Campo | 50.9% | 167 |
| Seymour | 50.9% | 171 |
| Paris | 50.8% | 297 |
| Parsons | 50.8% | 61 |
| Brevard | 50.8% | 366 |
| Athens | 50.8% | 930 |
| Mineral Wells | 50.8% | 333 |
| Eugene | 50.8% | 1,722 |
| Spearfish | 50.7% | 292 |
| Payson | 50.7% | 689 |
| Boone | 50.7% | 618 |
| Somerset | 50.6% | 445 |
| Oak Harbor | 50.5% | 568 |
| Idaho Falls | 50.5% | 881 |
| Safford | 50.5% | 109 |
| Waco | 50.4% | 1,719 |
| Tifton | 50.4% | 121 |
| Fairfield | 50.4% | 123 |
| Spartanburg | 50.4% | 2,796 |
| Greenville | 50.3% | 155 |
| Midland | 50.2% | 838 |
| Columbus | 50.2% | 219 |
| Greenville | 50.1% | 5,529 |
| Fort Collins | 50.1% | 2,625 |
| Santa Fe | 50.1% | 1,062 |
| Cullman | 50.1% | 587 |
| Augusta | 50.1% | 727 |
| Raleigh | 50.1% | 8,692 |
| Washington | 50.0% | 88 |
| Sturgis | 50.0% | 244 |
| Spencer | 50.0% | 92 |
| Red Wing | 50.0% | 224 |
| Quincy | 50.0% | 236 |
| Cookeville | 49.9% | 715 |
| Evansville | 49.9% | 1,314 |
| Hammond | 49.9% | 706 |
| Alexandria | 49.8% | 480 |
| Panama City | 49.8% | 3,726 |
| Butte | 49.8% | 227 |
| Pullman | 49.8% | 201 |
| Fort Morgan | 49.7% | 189 |
| Berlin | 49.7% | 366 |
| Ukiah | 49.7% | 499 |
| The Dalles | 49.7% | 165 |
| Durango | 49.7% | 642 |
| Henderson | 49.7% | 153 |
| Owensboro | 49.7% | 447 |
| Crawfordsville | 49.6% | 135 |
| Des Moines | 49.6% | 5,035 |
| Show Low | 49.6% | 1,135 |
| Albertville | 49.6% | 506 |
| Mcpherson | 49.6% | 119 |
| Lewisburg | 49.5% | 315 |
| Yankton | 49.5% | 103 |
| Great Bend | 49.5% | 99 |
| Corinth | 49.5% | 99 |
| Wenatchee | 49.5% | 859 |
| Bay City | 49.5% | 283 |
| Corsicana | 49.4% | 336 |
| Rocky Mount | 49.4% | 737 |
| Kalispell | 49.4% | 1,100 |
| Stephenville | 49.3% | 294 |
| Ellensburg | 49.3% | 511 |
| Jacksonville | 49.3% | 11,946 |
| New Castle | 49.3% | 215 |
| Brownwood | 49.3% | 284 |
| Lewiston | 49.3% | 349 |
| Fort Payne | 49.3% | 276 |
| Newberry | 49.3% | 134 |
| Lufkin | 49.2% | 390 |
| Houma | 49.2% | 973 |
| Gadsden | 49.2% | 447 |
| West Point | 49.2% | 63 |
| Silver City | 49.1% | 171 |
| Lewiston | 49.1% | 497 |
| Youngstown | 49.1% | 1,489 |
| Willmar | 49.1% | 210 |
| Scottsboro | 49.0% | 208 |
| Moses Lake | 49.0% | 700 |
| Hood River | 49.0% | 98 |
| Alma | 49.0% | 147 |
| Huron | 48.9% | 45 |
| Gainesville | 48.9% | 2,150 |
| Bellefontaine | 48.8% | 301 |
| Danville | 48.8% | 287 |
| Goldsboro | 48.7% | 478 |
| Phoenix | 48.7% | 28,431 |
| Shelbyville | 48.7% | 267 |
| Sweetwater | 48.7% | 76 |
| Logansport | 48.7% | 113 |
| Breckenridge | 48.7% | 939 |
| Deltona | 48.7% | 8,237 |
| Adrian | 48.6% | 368 |
| Dayton | 48.6% | 3,297 |
| Ketchikan | 48.6% | 72 |
| Glasgow | 48.6% | 288 |
| Cambridge | 48.6% | 278 |
| Altoona | 48.5% | 410 |
| Charleston | 48.5% | 5,832 |
| Tahlequah | 48.5% | 231 |
| Albert Lea | 48.4% | 159 |
| Columbus | 48.4% | 7,799 |
| Mount Pleasant | 48.4% | 244 |
| Burlington | 48.3% | 811 |
| Greensboro | 48.3% | 3,232 |
| Chattanooga | 48.3% | 3,698 |
| Grants | 48.3% | 58 |
| Marion | 48.3% | 230 |
| Wilmington | 48.3% | 2,292 |
| Talladega | 48.2% | 336 |
| Steamboat Springs | 48.2% | 446 |
| Huntingdon | 48.2% | 112 |
| Decatur | 48.2% | 704 |
| Ocala | 48.2% | 4,901 |
| Oklahoma City | 48.1% | 8,197 |
| Gainesville | 48.1% | 1,326 |
| Columbia | 48.1% | 4,758 |
| Longview | 48.1% | 1,498 |
| Bremerton | 48.1% | 1,203 |
| Lexington | 48.0% | 152 |
| St. Joseph | 48.0% | 429 |
| Moultrie | 48.0% | 100 |
| Cumberland | 48.0% | 425 |
| Missoula | 48.0% | 636 |
| Coldwater | 48.0% | 171 |
| Seattle | 47.9% | 16,488 |
| Orlando | 47.9% | 19,657 |
| Winston | 47.9% | 3,267 |
| Andrews | 47.9% | 94 |
| Midland | 47.8% | 320 |
| Pahrump | 47.8% | 661 |
| Roanoke | 47.8% | 1,607 |
| Elk City | 47.8% | 113 |
| Eureka | 47.8% | 632 |
| North Wilkesboro | 47.8% | 247 |
| Port Lavaca | 47.8% | 201 |
| Twin Falls | 47.8% | 666 |
| Homosassa Springs | 47.7% | 2,418 |
| Columbus | 47.7% | 350 |
| Alexandria | 47.7% | 218 |
| Frankfort | 47.7% | 109 |
| Dubuque | 47.7% | 327 |
| Georgetown | 47.6% | 764 |
| Burlington | 47.6% | 1,033 |
| Shawnee | 47.6% | 378 |
| Blacksburg | 47.6% | 624 |
| Garden City | 47.6% | 187 |
| Memphis | 47.5% | 6,582 |
| Martinsville | 47.5% | 261 |
| Santa Cruz | 47.5% | 739 |
| Dalton | 47.4% | 508 |
| Augusta | 47.4% | 3,710 |
| Prescott Valley | 47.4% | 2,702 |
| Athens | 47.4% | 306 |
| Beeville | 47.4% | 133 |
| Bowling Green | 47.4% | 1,077 |
| Tullahoma | 47.3% | 710 |
| Arcadia | 47.3% | 222 |
| Baton Rouge | 47.3% | 4,268 |
| Kokomo | 47.3% | 364 |
| Hays | 47.2% | 127 |
| Norfolk | 47.2% | 197 |
| St. Cloud | 47.2% | 774 |
| Kennewick | 47.1% | 1,557 |
| Cadillac | 47.1% | 280 |
| Warrensburg | 47.1% | 244 |
| Brainerd | 47.1% | 747 |
| Sault Ste. Marie | 47.1% | 240 |
| Pocatello | 47.1% | 512 |
| Cambridge | 47.1% | 102 |
| Killeen | 47.0% | 3,480 |
| Palm Bay | 47.0% | 5,470 |
| Elkins | 47.0% | 115 |
| Tulsa | 46.9% | 4,891 |
| Spokane | 46.9% | 3,286 |
| Sevierville | 46.9% | 2,120 |
| Elizabethtown | 46.9% | 763 |
| Frankfort | 46.9% | 324 |
| Lake City | 46.9% | 418 |
| Alpena | 46.9% | 143 |
| Chico | 46.8% | 1,091 |
| Fairbanks | 46.8% | 504 |
| St. Marys | 46.8% | 472 |
| Myrtle Beach | 46.8% | 12,122 |
| Montrose | 46.8% | 549 |
| Rock Springs | 46.8% | 156 |
| London | 46.8% | 526 |
| Fort Leonard Wood | 46.8% | 278 |
| Amsterdam | 46.8% | 246 |
| Astoria | 46.7% | 383 |
| Mountain Home | 46.7% | 364 |
| Manitowoc | 46.7% | 227 |
| Ozark | 46.7% | 180 |
| Durham | 46.7% | 3,486 |
| Red Bluff | 46.7% | 343 |
| Corpus Christi | 46.7% | 3,361 |
| Morristown | 46.6% | 783 |
| Hilton Head Island | 46.6% | 2,795 |
| Provo | 46.6% | 3,575 |
| Thomaston | 46.5% | 129 |
| Levelland | 46.5% | 86 |
| Salisbury | 46.5% | 4,768 |
| Fayetteville | 46.5% | 3,500 |
| Reno | 46.5% | 2,058 |
| Vernon | 46.4% | 28 |
| Marion | 46.4% | 291 |
| Bainbridge | 46.4% | 97 |
| Albuquerque | 46.4% | 3,539 |
| Murray | 46.4% | 151 |
| Lakeland | 46.4% | 8,183 |
| Gainesville | 46.3% | 367 |
| Winchester | 46.3% | 693 |
| Saginaw | 46.3% | 678 |
| Wilson | 46.3% | 322 |
| Florence | 46.2% | 913 |
| Eufaula | 46.2% | 145 |
| Enid | 46.2% | 290 |
| Vernal | 46.2% | 184 |
| Pittsburgh | 46.2% | 7,447 |
| Bloomington | 46.2% | 847 |
| Guymon | 46.2% | 65 |
| Fayetteville | 46.1% | 4,538 |
| Watertown | 46.1% | 659 |
| San Luis Obispo | 46.1% | 1,141 |
| Flint | 46.1% | 1,567 |
| Rochester | 46.1% | 1,040 |
| Uvalde | 46.1% | 165 |
| Victoria | 46.0% | 428 |
| Pearsall | 46.0% | 63 |
| Crestview | 46.0% | 4,962 |
| Morgan City | 46.0% | 150 |
| The Villages | 46.0% | 1,046 |
| Sidney | 46.0% | 174 |
| Blackfoot | 46.0% | 224 |
| Grenada | 46.0% | 74 |
| Ardmore | 46.0% | 383 |
| Duncan | 45.9% | 246 |
| Jackson | 45.9% | 897 |
| Dixon | 45.9% | 98 |
| Atlanta | 45.9% | 33,508 |
| Muncie | 45.9% | 451 |
| La Grande | 45.9% | 133 |
| Tucson | 45.8% | 5,935 |
| New Ulm | 45.8% | 96 |
| Menomonie | 45.8% | 120 |
| Knoxville | 45.8% | 5,230 |
| Jackson | 45.8% | 2,368 |
| Urbana | 45.8% | 131 |
| Boulder | 45.8% | 1,830 |
| Vincennes | 45.7% | 129 |
| Othello | 45.7% | 70 |
| Lake Havasu City | 45.7% | 2,470 |
| Mason City | 45.7% | 357 |
| North Port | 45.7% | 11,780 |
| Watertown | 45.6% | 160 |
| Huntington | 45.6% | 125 |
| Oskaloosa | 45.6% | 68 |
| Ottumwa | 45.6% | 158 |
| Ogdensburg | 45.6% | 663 |
| Cleveland | 45.5% | 740 |
| Zanesville | 45.5% | 224 |
| Dodge City | 45.5% | 134 |
| Athens | 45.5% | 156 |
| New Orleans | 45.5% | 7,728 |
| Hattiesburg | 45.5% | 589 |
| Dublin | 45.5% | 211 |
| Bay City | 45.5% | 398 |
| Mcalester | 45.5% | 310 |
| Gulfport | 45.5% | 2,780 |
| Rolla | 45.5% | 209 |
| Punta Gorda | 45.5% | 4,114 |
| Dyersburg | 45.5% | 154 |
| Jefferson | 45.4% | 890 |
| Alexander City | 45.4% | 304 |
| Springfield | 45.4% | 509 |
| Meridian | 45.4% | 216 |
| Jackson | 45.4% | 668 |
| Richmond | 45.4% | 560 |
| Lima | 45.4% | 399 |
| Statesboro | 45.3% | 386 |
| Waycross | 45.3% | 267 |
| Napa | 45.3% | 715 |
| Dothan | 45.3% | 766 |
| Dayton | 45.2% | 168 |
| Union City | 45.2% | 126 |
| Redding | 45.2% | 971 |
| Huntsville | 45.2% | 363 |
| Pensacola | 45.2% | 4,009 |
| Dover | 45.1% | 884 |
| Paris | 45.1% | 226 |
| New Castle | 45.1% | 266 |
| Niles | 45.1% | 841 |
| Muskogee | 45.1% | 333 |
| Waterloo | 45.0% | 686 |
| Jacksonville | 45.0% | 1,550 |
| Dickinson | 45.0% | 171 |
| Truckee | 45.0% | 722 |
| Logan | 45.0% | 700 |
| Harrison | 45.0% | 329 |
| Ruston | 45.0% | 129 |
| Cedar City | 45.0% | 685 |
| Plainview | 45.0% | 109 |
| Lubbock | 45.0% | 2,051 |
| Ames | 44.9% | 563 |
| Bellingham | 44.9% | 1,293 |
| Martin | 44.9% | 118 |
| Mankato | 44.9% | 463 |
| Cañon City | 44.9% | 450 |
| Terre Haute | 44.9% | 700 |
| Sulphur Springs | 44.9% | 214 |
| Hagerstown | 44.8% | 1,285 |
| Greensburg | 44.8% | 96 |
| Rockport | 44.8% | 757 |
| Birmingham | 44.8% | 5,700 |
| Battle Creek | 44.7% | 541 |
| Kerrville | 44.7% | 559 |
| Mobile | 44.7% | 1,742 |
| Bloomsburg | 44.6% | 280 |
| Laconia | 44.6% | 540 |
| Marion | 44.6% | 186 |
| Riverton | 44.6% | 213 |
| South Bend | 44.6% | 1,229 |
| Port St. Lucie | 44.6% | 5,771 |
| Ludington | 44.6% | 175 |
| Huntsville | 44.6% | 3,872 |
| Warsaw | 44.6% | 330 |
| Platteville | 44.5% | 128 |
| Kendallville | 44.5% | 137 |
| Lake Charles | 44.5% | 1,076 |
| Yuba City | 44.5% | 690 |
| Ruidoso | 44.5% | 931 |
| Storm Lake | 44.4% | 81 |
| Tupelo | 44.4% | 581 |
| Fergus Falls | 44.4% | 401 |
| Enterprise | 44.4% | 320 |
| Las Vegas | 44.4% | 14,264 |
| Española | 44.3% | 106 |
| Lynchburg | 44.3% | 1,271 |
| Staunton | 44.3% | 508 |
| Angola | 44.3% | 201 |
| Bardstown | 44.3% | 226 |
| Wichita Falls | 44.2% | 608 |
| Washington | 44.2% | 251 |
| Michigan City | 44.2% | 430 |
| Sumter | 44.2% | 772 |
| Brookhaven | 44.1% | 111 |
| Bogalusa | 44.1% | 145 |
| Calhoun | 44.1% | 288 |
| Jacksonville | 44.1% | 313 |
| Meadville | 44.1% | 254 |
| Gaffney | 44.1% | 227 |
| Eau Claire | 44.0% | 589 |
| Fargo | 44.0% | 1,192 |
| Houston | 44.0% | 46,078 |
| Mount Sterling | 43.9% | 255 |
| Coffeyville | 43.9% | 148 |
| Hutchinson | 43.9% | 123 |
| Magnolia | 43.9% | 82 |
| Morehead City | 43.9% | 850 |
| Hinesville | 43.9% | 645 |
| Carson City | 43.9% | 228 |
| Mountain Home | 43.9% | 187 |
| Valdosta | 43.9% | 748 |
| Muskegon | 43.8% | 753 |
| Hillsdale | 43.8% | 178 |
| Cape Coral | 43.8% | 13,147 |
| Pierre | 43.8% | 105 |
| Louisville | 43.8% | 5,728 |
| Clinton | 43.8% | 169 |
| Vallejo | 43.8% | 1,359 |
| Billings | 43.8% | 1,149 |
| Ontario | 43.8% | 313 |
| Texarkana | 43.8% | 720 |
| Taos | 43.8% | 240 |
| Douglas | 43.8% | 128 |
| Shreveport | 43.7% | 1,749 |
| Tyler | 43.7% | 1,622 |
| Clarksville | 43.7% | 2,501 |
| Somerset | 43.7% | 197 |
| Las Vegas | 43.7% | 126 |
| Russellville | 43.7% | 417 |
| Hilo | 43.7% | 1,363 |
| Aberdeen | 43.6% | 110 |
| Corvallis | 43.6% | 385 |
| Cedartown | 43.6% | 165 |
| Wheeling | 43.6% | 463 |
| West Plains | 43.6% | 243 |
| Hermiston | 43.6% | 422 |
| Flagstaff | 43.6% | 1,071 |
| Van Wert | 43.6% | 78 |
| Toccoa | 43.6% | 156 |
| Durant | 43.6% | 280 |
| Kingsville | 43.5% | 147 |
| Jackson | 43.5% | 354 |
| Bemidji | 43.5% | 200 |
| Rockingham | 43.5% | 138 |
| Liberal | 43.5% | 69 |
| Monroe | 43.5% | 513 |
| Montgomery | 43.5% | 1,776 |
| Auburn | 43.4% | 389 |
| Weirton | 43.4% | 320 |
| Fairmont | 43.4% | 99 |
| Jennings | 43.4% | 99 |
| Natchitoches | 43.4% | 129 |
| St. George | 43.4% | 2,399 |
| Faribault | 43.4% | 263 |
| Rexburg | 43.3% | 344 |
| Easton | 43.3% | 314 |
| Branson | 43.3% | 1,079 |
| Bluefield | 43.2% | 389 |
| Sioux City | 43.1% | 552 |
| Oxnard | 43.1% | 2,250 |
| Jesup | 43.1% | 174 |
| Little Rock | 43.1% | 3,963 |
| Baltimore | 43.1% | 10,141 |
| Fort Dodge | 43.0% | 158 |
| Lagrange | 43.0% | 456 |
| Fort Wayne | 43.0% | 1,538 |
| Burley | 42.9% | 163 |
| Galesburg | 42.9% | 184 |
| Odessa | 42.9% | 487 |
| Fort Smith | 42.9% | 1,265 |
| Salem | 42.9% | 289 |
| Richmond | 42.9% | 238 |
| Vidalia | 42.9% | 126 |
| Mitchell | 42.9% | 91 |
| Atchison | 42.9% | 56 |
| Sacramento | 42.8% | 8,394 |
| Searcy | 42.8% | 355 |
| Anchorage | 42.8% | 1,694 |
| Kalamazoo | 42.8% | 1,003 |
| Wilmington | 42.8% | 145 |
| Hannibal | 42.8% | 152 |
| Miami | 42.8% | 138 |
| Sterling | 42.7% | 117 |
| Las Cruces | 42.7% | 985 |
| Elkhart | 42.7% | 639 |
| Malvern | 42.7% | 143 |
| Marshall | 42.6% | 101 |
| Crescent City | 42.5% | 174 |
| East Stroudsburg | 42.5% | 1,308 |
| Cincinnati | 42.5% | 7,259 |
| Bartlesville | 42.5% | 280 |
| Yakima | 42.5% | 925 |
| Connersville | 42.5% | 113 |
| Cleveland | 42.5% | 73 |
| Fitzgerald | 42.5% | 73 |
| Alice | 42.5% | 186 |
| Paducah | 42.5% | 391 |
| Lansing | 42.5% | 1,804 |
| Washington Court House | 42.4% | 99 |
| Campbellsville | 42.4% | 203 |
| Greenwood | 42.3% | 326 |
| Santa Rosa | 42.3% | 1,571 |
| Morgantown | 42.3% | 454 |
| Portales | 42.3% | 71 |
| Madison | 42.2% | 2,273 |
| Fredericksburg | 42.2% | 502 |
| Farmington | 42.2% | 289 |
| Nashville | 42.2% | 14,649 |
| Danville | 42.2% | 391 |
| Daphne | 42.2% | 3,661 |
| Tallahassee | 42.2% | 1,705 |
| College Station | 42.1% | 1,856 |
| Union | 42.1% | 95 |
| Palestine | 42.1% | 228 |
| Clarksburg | 42.1% | 247 |
| Lebanon | 42.0% | 1,413 |
| Winfield | 42.0% | 169 |
| Americus | 42.0% | 100 |
| Athens | 42.0% | 1,017 |
| Pottsville | 42.0% | 548 |
| Pittsfield | 42.0% | 832 |
| Chillicothe | 42.0% | 205 |
| Charlottesville | 42.0% | 1,192 |
| Kearney | 41.9% | 186 |
| Malone | 41.9% | 246 |
| Findlay | 41.9% | 215 |
| Key West | 41.8% | 1,439 |
| Topeka | 41.8% | 703 |
| Edwards | 41.8% | 751 |
| Champaign | 41.8% | 670 |
| Hailey | 41.8% | 237 |
| Gloversville | 41.8% | 340 |
| Clovis | 41.7% | 254 |
| Jamestown | 41.7% | 722 |
| Emporia | 41.7% | 108 |
| Elmira | 41.7% | 468 |
| Minneapolis | 41.7% | 14,559 |
| Milledgeville | 41.6% | 310 |
| Decatur | 41.6% | 351 |
| Fallon | 41.6% | 125 |
| Wabash | 41.6% | 101 |
| Duluth | 41.6% | 1,282 |
| Carbondale | 41.6% | 606 |
| Winona | 41.6% | 142 |
| Bennettsville | 41.5% | 53 |
| Stockton | 41.5% | 2,179 |
| Sterling | 41.5% | 176 |
| Hot Springs | 41.5% | 1,080 |
| Sierra Vista | 41.5% | 873 |
| Barre | 41.5% | 381 |
| Salinas | 41.4% | 777 |
| Hudson | 41.4% | 461 |
| Danville | 41.4% | 186 |
| Williston | 41.4% | 157 |
| Marietta | 41.4% | 157 |
| Clewiston | 41.4% | 401 |
| Kinston | 41.4% | 232 |
| Portsmouth | 41.3% | 201 |
| Anniston | 41.3% | 419 |
| Parkersburg | 41.3% | 223 |
| Pinehurst | 41.2% | 999 |
| Sandpoint | 41.2% | 597 |
| Mccomb | 41.2% | 153 |
| Thomasville | 41.2% | 243 |
| Manhattan | 41.1% | 496 |
| Traverse City | 41.1% | 1,204 |
| California | 41.1% | 377 |
| Boise City | 41.1% | 4,992 |
| Tuscaloosa | 41.1% | 1,090 |
| Owatonna | 41.1% | 163 |
| Ponca City | 41.1% | 185 |
| Holland | 41.1% | 509 |
| Lexington | 41.1% | 2,117 |
| Kill Devil Hills | 41.1% | 570 |
| Williamsport | 41.0% | 356 |
| Johnstown | 41.0% | 361 |
| Scottsburg | 41.0% | 83 |
| Carroll | 41.0% | 105 |
| Grand Rapids | 40.9% | 3,532 |
| Greenville | 40.9% | 732 |
| Mount Pleasant | 40.8% | 262 |
| San Angelo | 40.8% | 757 |
| Columbus | 40.8% | 179 |
| Beckley | 40.8% | 368 |
| Cleveland | 40.8% | 6,805 |
| Virginia Beach | 40.7% | 5,747 |
| El Dorado | 40.7% | 140 |
| Natchez | 40.7% | 241 |
| North Vernon | 40.6% | 96 |
| Modesto | 40.6% | 1,343 |
| Cornelia | 40.5% | 269 |
| Pine Bluff | 40.5% | 336 |
| Vicksburg | 40.5% | 131 |
| Sunbury | 40.4% | 292 |
| St. Louis | 40.4% | 10,390 |
| Oil City | 40.3% | 181 |
| Kennett | 40.2% | 92 |
| Freeport | 40.2% | 189 |
| Beaumont | 40.2% | 1,676 |
| Batesville | 40.2% | 341 |
| Wahpeton | 40.2% | 122 |
| North Platte | 40.1% | 142 |
| Madera | 40.1% | 735 |
| Wichita | 40.1% | 2,411 |
| Bradford | 40.1% | 177 |
| Lumberton | 40.1% | 242 |
| Fernley | 40.1% | 337 |
| Orangeburg | 40.0% | 435 |
| Gallup | 40.0% | 60 |
| Rome | 40.0% | 518 |
| Huntington | 40.0% | 1,149 |
| DC | 39.9% | 21,813 |
| New Bern | 39.9% | 812 |
| Coeur D’alene | 39.9% | 1,394 |
| Sedalia | 39.9% | 163 |
| Pampa | 39.8% | 123 |
| Mayfield | 39.8% | 123 |
| Mount Vernon | 39.8% | 221 |
| Sebring | 39.8% | 1,437 |
| Ottawa | 39.8% | 98 |
| Middlesborough | 39.8% | 93 |
| Chambersburg | 39.8% | 581 |
| Point Pleasant | 39.7% | 141 |
| Los Alamos | 39.7% | 68 |
| Olean | 39.7% | 398 |
| Santa Maria | 39.7% | 970 |
| Watertown | 39.7% | 237 |
| Marshalltown | 39.7% | 116 |
| Portland | 39.6% | 3,141 |
| Picayune | 39.6% | 303 |
| Great Falls | 39.6% | 298 |
| Wisconsin Rapids | 39.5% | 258 |
| Hastings | 39.5% | 124 |
| Brunswick | 39.5% | 1,116 |
| Greenville | 39.5% | 119 |
| Vermillion | 39.5% | 76 |
| Auburn | 39.5% | 147 |
| Fairmont | 39.5% | 185 |
| Harrisonburg | 39.5% | 370 |
| Amarillo | 39.4% | 1,096 |
| Marquette | 39.4% | 297 |
| Starkville | 39.4% | 221 |
| Cortland | 39.3% | 183 |
| Gillette | 39.3% | 285 |
| Dubois | 39.3% | 219 |
| Helena | 39.2% | 441 |
| Big Spring | 39.2% | 209 |
| Jackson | 39.2% | 102 |
| Ithaca | 39.2% | 436 |
| Nogales | 39.2% | 319 |
| New Philadelphia | 39.2% | 194 |
| Taylorville | 39.2% | 120 |
| Coshocton | 39.1% | 69 |
| Hanford | 39.1% | 386 |
| Ann Arbor | 39.1% | 1,347 |
| Roanoke Rapids | 39.1% | 202 |
| Harrisburg | 39.0% | 1,876 |
| Detroit | 39.0% | 17,426 |
| Macon | 39.0% | 1,193 |
| Wooster | 39.0% | 213 |
| Rapid City | 39.0% | 834 |
| Scottsbluff | 38.9% | 131 |
| Raymondville | 38.9% | 54 |
| Iron Mountain | 38.9% | 139 |
| Visalia | 38.8% | 1,327 |
| Maysville | 38.8% | 49 |
| Vineyard Haven | 38.8% | 276 |
| Springfield | 38.7% | 2,424 |
| Vineland | 38.7% | 550 |
| Evanston | 38.7% | 75 |
| Casper | 38.7% | 269 |
| Bozeman | 38.6% | 906 |
| Fort Madison | 38.6% | 246 |
| San Diego | 38.6% | 8,489 |
| Utica | 38.6% | 1,487 |
| Miami | 38.5% | 51,940 |
| Jasper | 38.5% | 161 |
| Shawano | 38.5% | 161 |
| Akron | 38.5% | 2,041 |
| Fresno | 38.5% | 2,380 |
| Lawton | 38.4% | 601 |
| Cullowhee | 38.4% | 268 |
| Philadelphia | 38.4% | 21,314 |
| Scranton | 38.4% | 2,114 |
| Ashtabula | 38.4% | 305 |
| Woodward | 38.3% | 107 |
| Kansas City | 38.2% | 9,526 |
| Oxford | 38.2% | 474 |
| Laurel | 38.2% | 228 |
| Marinette | 38.1% | 328 |
| Charleston | 38.1% | 704 |
| Riverside | 38.1% | 19,510 |
| Fond Du Lac | 38.1% | 297 |
| Central City | 38.1% | 113 |
| Keene | 38.0% | 329 |
| Marshall | 38.0% | 79 |
| Columbia | 37.9% | 847 |
| Spirit Lake | 37.9% | 322 |
| Elizabeth City | 37.9% | 391 |
| Paragould | 37.8% | 185 |
| Heber | 37.8% | 1,752 |
| Lewisburg | 37.8% | 90 |
| Lawrence | 37.8% | 368 |
| Gardnerville Ranchos | 37.8% | 376 |
| Tiffin | 37.8% | 143 |
| Summerville | 37.7% | 106 |
| Worcester | 37.7% | 3,597 |
| Minot | 37.7% | 313 |
| Poplar Bluff | 37.7% | 324 |
| Bluffton | 37.7% | 85 |
| Auburn | 37.6% | 975 |
| Stillwater | 37.6% | 383 |
| Naples | 37.6% | 6,035 |
| Kahului | 37.6% | 1,683 |
| Alamogordo | 37.6% | 514 |
| Albany | 37.5% | 682 |
| Roswell | 37.5% | 285 |
| Bakersfield | 37.5% | 2,980 |
| Richmond | 37.5% | 4,903 |
| Hutchinson | 37.5% | 176 |
| Bloomington | 37.4% | 380 |
| Green Bay | 37.4% | 1,025 |
| Selma | 37.4% | 91 |
| St. Marys | 37.3% | 75 |
| Deming | 37.3% | 134 |
| Trenton | 37.3% | 1,311 |
| Joplin | 37.3% | 920 |
| Carlsbad | 37.3% | 255 |
| Rutland | 37.2% | 403 |
| Deridder | 37.2% | 164 |
| Arkadelphia | 37.1% | 140 |
| Baraboo | 37.1% | 291 |
| Madisonville | 37.1% | 213 |
| Grand Rapids | 37.1% | 232 |
| Glens Falls | 37.1% | 707 |
| Okeechobee | 36.9% | 398 |
| Kingston | 36.9% | 1,038 |
| Peoria | 36.9% | 1,255 |
| Merced | 36.9% | 702 |
| El Centro | 36.8% | 323 |
| Madison | 36.8% | 163 |
| Kirksville | 36.8% | 163 |
| Grand Island | 36.8% | 204 |
| Torrington | 36.7% | 953 |
| Snyder | 36.7% | 49 |
| Effingham | 36.7% | 98 |
| Whitewater | 36.7% | 513 |
| Janesville | 36.7% | 502 |
| Gettysburg | 36.6% | 437 |
| Mcallen | 36.5% | 4,073 |
| Poughkeepsie | 36.5% | 2,813 |
| Fort Polk South | 36.5% | 181 |
| Springfield | 36.5% | 2,192 |
| Opelousas | 36.4% | 228 |
| Centralia | 36.4% | 121 |
| State College | 36.4% | 429 |
| Escanaba | 36.3% | 135 |
| Beaver Dam | 36.3% | 237 |
| Pittsburg | 36.2% | 149 |
| Racine | 36.2% | 588 |
| Warner Robins | 36.2% | 967 |
| Pontiac | 36.2% | 130 |
| Cape Girardeau | 36.1% | 421 |
| Sebastian | 36.1% | 1,947 |
| Burlington | 36.0% | 197 |
| Stevens Point | 36.0% | 197 |
| Elko | 36.0% | 189 |
| Los Angeles | 36.0% | 30,016 |
| Davenport | 36.0% | 1,388 |
| Corning | 35.9% | 409 |
| Erie | 35.9% | 732 |
| Brookings | 35.9% | 106 |
| Laramie | 35.8% | 162 |
| Concord | 35.8% | 581 |
| Barnstable Town | 35.8% | 1,826 |
| Binghamton | 35.7% | 1,164 |
| Abilene | 35.7% | 803 |
| Selinsgrove | 35.7% | 84 |
| Salina | 35.7% | 182 |
| Jamestown | 35.6% | 73 |
| Farmington | 35.6% | 278 |
| Brownsville | 35.5% | 1,856 |
| Mount Vernon | 35.5% | 124 |
| Altus | 35.5% | 124 |
| Grand Forks | 35.4% | 364 |
| Bismarck | 35.4% | 565 |
| Sandusky | 35.3% | 394 |
| Plymouth | 35.3% | 156 |
| Oshkosh | 35.2% | 452 |
| Lewistown | 35.0% | 123 |
| Nacogdoches | 34.9% | 209 |
| Mount Gay | 34.9% | 43 |
| Zapata | 34.8% | 46 |
| Indianola | 34.8% | 46 |
| Wausau | 34.7% | 501 |
| Ada | 34.7% | 167 |
| Springfield | 34.7% | 602 |
| Kapaa | 34.6% | 462 |
| Austin | 34.6% | 165 |
| Urban Honolulu | 34.5% | 4,560 |
| Jonesboro | 34.5% | 748 |
| Winnemucca | 34.4% | 90 |
| Atmore | 34.4% | 90 |
| Defiance | 34.4% | 93 |
| Eagle Pass | 34.4% | 282 |
| Sheboygan | 34.4% | 346 |
| Hope | 34.4% | 96 |
| Canton | 34.4% | 1,082 |
| Lafayette | 34.3% | 1,845 |
| Bennington | 34.3% | 254 |
| Columbus | 34.2% | 1,182 |
| Norwalk | 34.2% | 158 |
| Weatherford | 33.9% | 121 |
| Sheridan | 33.8% | 198 |
| Lincoln | 33.8% | 71 |
| Oneonta | 33.6% | 405 |
| York | 33.5% | 1,604 |
| Reading | 33.5% | 990 |
| Toledo | 33.5% | 2,290 |
| La Crosse | 33.4% | 407 |
| Helena | 33.3% | 42 |
| Moberly | 33.3% | 108 |
| Milwaukee | 33.3% | 4,132 |
| Ottawa | 33.2% | 506 |
| Susanville | 32.7% | 168 |
| San Jose | 32.7% | 3,189 |
| Cheyenne | 32.5% | 480 |
| Celina | 32.4% | 71 |
| Allentown | 32.4% | 2,569 |
| Wapakoneta | 32.4% | 136 |
| Jefferson City | 32.3% | 436 |
| Boston | 32.3% | 17,374 |
| Lebanon | 32.2% | 152 |
| Lebanon | 32.2% | 537 |
| Indiana | 32.2% | 177 |
| Charleston | 32.1% | 184 |
| Manchester | 32.1% | 1,216 |
| Fremont | 32.1% | 156 |
| Monroe | 31.9% | 461 |
| Sioux Falls | 31.8% | 1,538 |
| New Haven | 31.6% | 2,816 |
| Albany | 31.6% | 3,663 |
| Appleton | 31.6% | 630 |
| Beatrice | 31.6% | 95 |
| Sikeston | 31.4% | 121 |
| Del Rio | 31.4% | 312 |
| Forrest City | 31.4% | 51 |
| Dumas | 31.3% | 67 |
| Juneau | 31.3% | 115 |
| Clarksdale | 31.3% | 64 |
| Hobbs | 30.8% | 146 |
| Cedar Rapids | 30.8% | 994 |
| Yuma | 30.7% | 1,233 |
| El Paso | 30.6% | 2,784 |
| Rockford | 30.6% | 955 |
| Sayre | 30.5% | 154 |
| Fremont | 30.5% | 141 |
| Camden | 30.5% | 141 |
| Omaha | 30.3% | 3,917 |
| Wauchula | 30.2% | 86 |
| Troy | 29.8% | 114 |
| Chicago | 29.8% | 23,774 |
| Jacksonville | 29.8% | 94 |
| Buffalo | 29.7% | 5,214 |
| Warren | 29.7% | 155 |
| San Francisco | 29.5% | 8,733 |
| Greenwood | 29.4% | 109 |
| Rochelle | 29.3% | 164 |
| Laredo | 29.3% | 759 |
| Seneca Falls | 28.8% | 132 |
| Syracuse | 28.5% | 2,782 |
| Providence | 28.5% | 5,426 |
| Lancaster | 28.5% | 1,285 |
| New York | 27.7% | 53,412 |
| Kankakee | 27.4% | 317 |
| Norwich | 27.3% | 943 |
| Ocean City | 26.9% | 944 |
| Muscatine | 26.7% | 161 |
| Bridgeport | 26.6% | 3,213 |
| Decatur | 26.2% | 65 |
| Iowa City | 26.0% | 780 |
| Blytheville | 25.7% | 140 |
| Rio Grande City | 25.0% | 144 |
| Ashland | 24.4% | 127 |
| Hartford | 24.1% | 3,294 |
| Batavia | 23.6% | 157 |
| Lincoln | 23.1% | 1,533 |
| Bucyrus | 21.8% | 133 |
| Glenwood Springs | 21.2% | 794 |
| Atlantic City | 19.8% | 1,180 |
| Mansfield | 19.8% | 349 |
| Rochester | 19.7% | 3,349 |
| Craig | 19.0% | 121 |
| Pecos | 17.1% | 35 |
Table 2: Share of Listings with a Price Cut for All Metros Tracked by Parcl Labs
References
[i] https://fred.stlouisfed.org/series/MEDLISPRIUS
[ii] https://www.zillow.com/research/monthly-snapshot/
[iii] https://www.zillow.com/research/zed/
[iv] Ibid
[v] https://www.redfin.com/news/price-drop-rate-ticks-up/
[vi] https://www.consumerfinance.gov/ask-cfpb/what-is-a-home-equity-line-of-credit-heloc-en-107
[vii] https://guide-selling.fanniemae.com/sel/b4-1.1-01/definition-market-value
[viii] https://www.nar.realtor/the-facts/consumer-guide-what-goes-into-pricing-your-home
[ix] https://www.redfin.com/blog/when-to-lower-the-price-of-your-house/
RECENT/RELATED RESEARCH
Requiring Affordability VS. Enabling It: Inclusionary Housing in Colorado

Executive Summary Inclusionary housing policies require new residential developments to set aside a percentage (typically 5-25%) of units as affordable…
More Homes, Smaller Households: Colorado Housing Supply and Demand

More Homes, Smaller Households: Colorado Housing Supply and Demand Executive Summary By count of housing units[1] per resident, Colorado’s housing…
Colorado’s Hot Housing Market May be Cooling
Colorado’s Hot Housing Market May be Cooling Key Findings Colorado Springs and Denver lead the nation’s large housing markets in…