Key Findings
• Iowa’s state revenue has exceeded state spending every year since 2018, resulting in record surplus and reserve fund balances. As of preliminary FY25, Iowa has an estimated $3.7 billion Taxpayer Relief Fund, $697.4 million Cash Reserve Fund, and a $232.5 million Economic Emergency Fund.
• State spending has outpaced inflation and population growth since 2000. Inflation-adjusted appropriations per Iowan has increased 11.21% from $2,883 in FY00 to $3,207 in FY25. Over the same period, non-appropriated federal funds grew 122%, primarily due to growth in federal healthcare spending starting in FY18.
• Since FY 2000, the Department of Education’s general fund budget has grown by 118% and its share of the total budget grew from 43% to 50%. Education accounted for 191% of the increase in General Fund appropriations in FY23, 94% in FY24, and 65% in FY25.
• State appropriations related to health and human services have seen the largest percent change in funding. In the last 25 years, state general fund spending for this function grew by 155.37% from $921 million to $2.35 billion. Its share of the general fund budget rose from 19.38% to 26.37%. From FY00 to FY24, all state and federal spending on healthcare grew from $2.39 to $8.67 billion, a 262% increase.
Methodology
The findings of this report are generated using data from the Iowa Department of Management and annual appropriations reports compiled by Iowa’s Legislative Services Agency. These reports draw from the state's budget packages, which are drafted by the Governor's office then revised and approved during each year's legislative session. They include appropriations to each of the state government's departments from all funds including the General Fund, Cash Funds, Federal Funds, and other miscellaneous Funds. This report categorizes various government agencies into general subject areas to give readers a broad view of the state’s budget priorities.
General Funds: General purpose revenue is deposited into the General Fund and used for the state’s core programs such as education, health care, human services, corrections, and general government (e.g., the legislature and Governor’s office). General Fund revenue is typically sourced through various taxes and fees.
Appropriated Funds are funds subject to legislative appropriation. The general fund is the largest appropriated fund, however the legislature also appropriates money from various other funds for specific purposes such as transportation and the environment.
Federal Funds are moneys received from the federal government to support specific purposes and programs. Though the state spends this money, Congress rather than the state legislature appropriates the funds; the state legislature has little or no control over them. However, Congress delegates authority to the legislature to allocate some federal funds, particularly federal grant dollars, at legislators’ discretion in the annual state budget.
The Cash Reserve Fund and Economic Emergency Fund are special-purpose funds funded from general fund surpluses. The cash fund acts similarly to a rainy-day fund, providing financial assistance in times of revenue shortfall or budgetary pressures. The emergency fund addresses more extreme financial crises, such as natural disasters, economic recessions, etc. State statute allows the legislature to allocate only 7.5% of the total surplus to the state’s cash fund and 2.5% to its emergency funds.
The Taxpayer Relief Fund exists to offset revenue losses from tax cuts if necessary to prevent state budget shortfalls. To date, backfilling from the TRF has not been necessary. See CSI’s June 2024 report, Iowa’s 2024 Income Tax Cuts, for more.
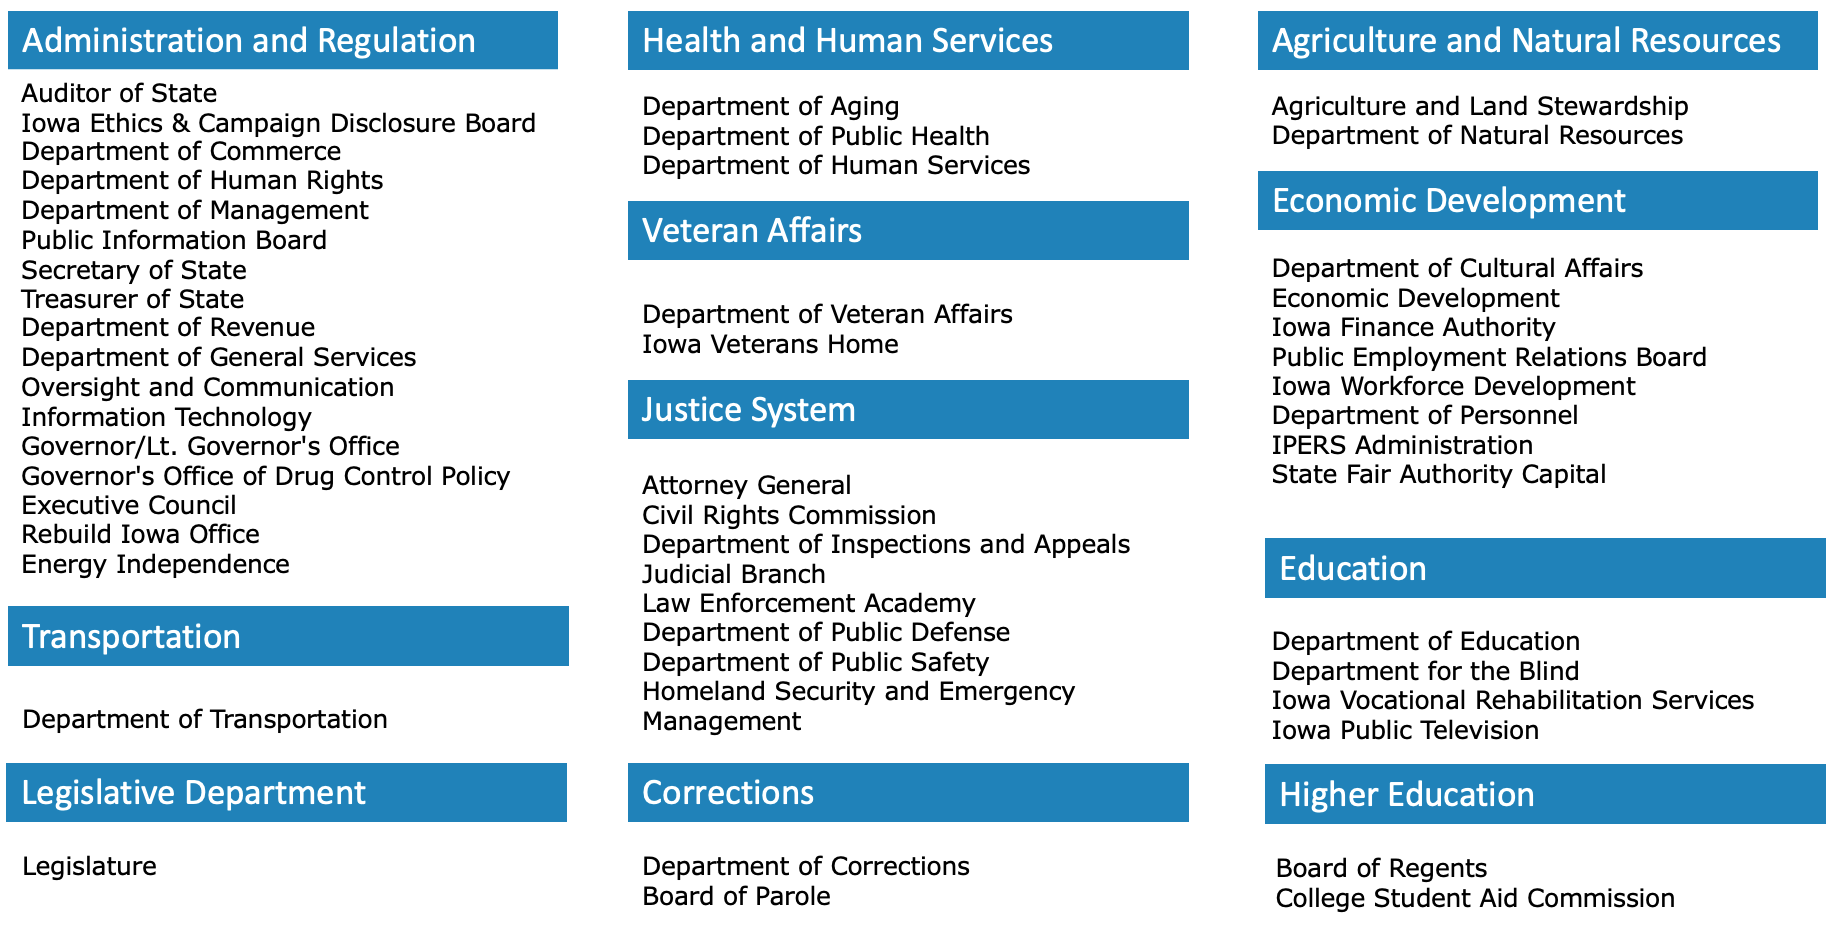
Departments by Spending Category in this Report
How Much Money Does the Iowa State Government Appropriate?
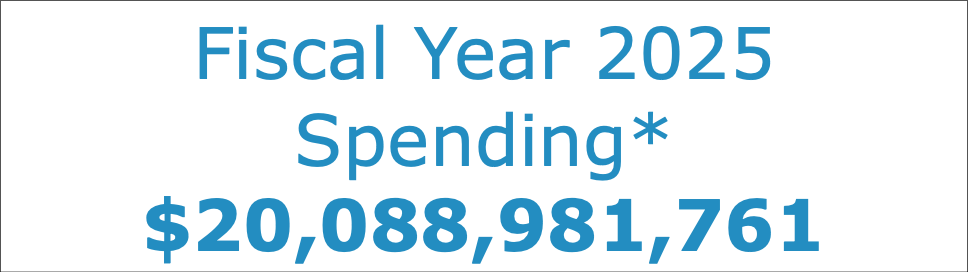
Each year, the state legislature approves and the governor signs a budget that allocates state revenue to government departments. The current budget cycle, fiscal year 2025, runs from July 1, 2024, through June 30, 2025. This year’s general fund budget approximated $8.9 billion. Additional legislative appropriations amount to approximately $1.4 billion. The state will also spend about $9.5 billion in federal dollars not allocated directly by the state legislature.
*FY25 Non-appropriated federal funding is estimated using the FY24 estimate from LSA and the ten-year growth rate.
State Government Appropriations: Flow of Tax Revenue from the Taxable Source to Categories
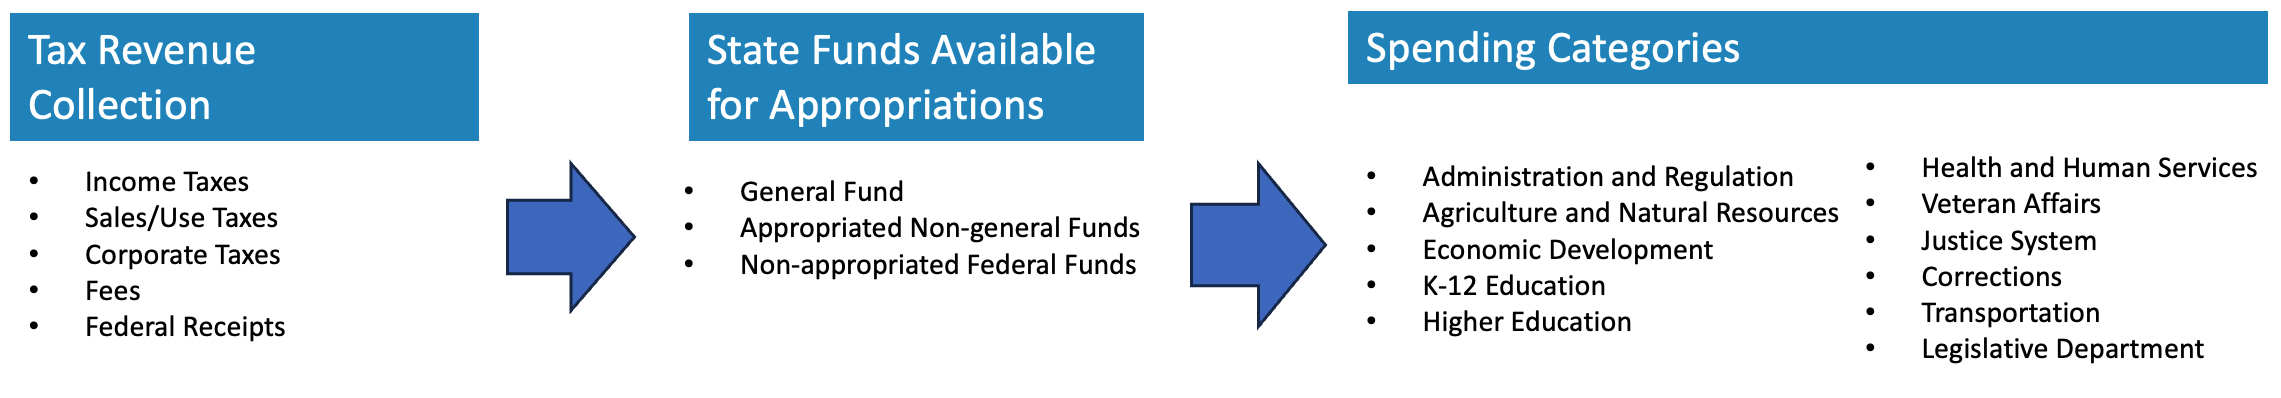
The image above illustrates the flow of state appropriations from tax revenue sources to the state departments that the legislature authorizes to spend state revenue. General Fund expenditures are limited to 99% of the adjusted appropriable revenue estimate determined by the Revenue Estimating Conference.
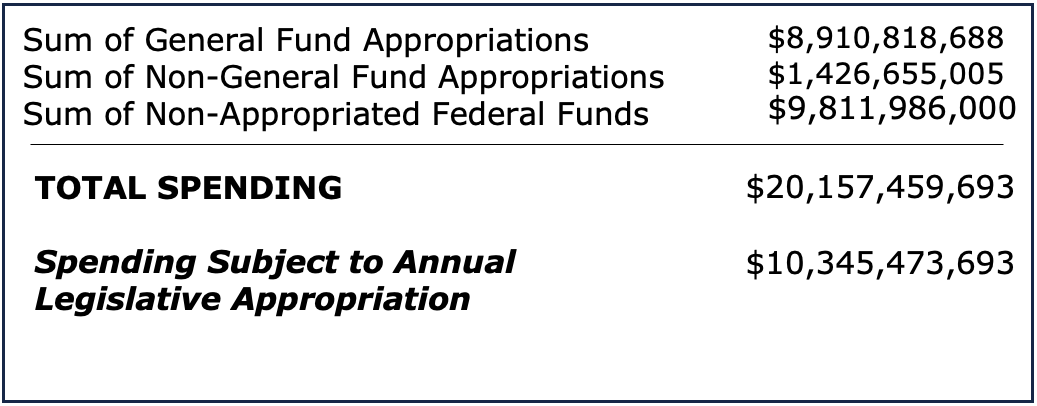
Iowa Total Spending by Funding Source: FY24 and FY25 (millions)
The state is authorized to spend $20.16 billion in FY25. Of that, General fund appropriations account for 44%, appropriated non-general funds account for 7%, and non-appropriated federal funds account for 49%.
Iowa Net Revenues and Appropriations FY03 to FY25 (millions)
Net general fund appropriations fell below net revenues in FY17 and have remained below since, increasing state surpluses and reserve funds. These surpluses have allowed the state to reduce income taxes while maintaining annual growth in the state budget.
Cash Reserve, Emergency, TRF, and Surplus Funds Since 2020 (millions)
Iowa experienced a $933 million, or 305%, increase in its annual surplus from 2020 to 2021. The state has maintained an ongoing surplus exceeding $1 billion since 2020 despite multiple rounds of tax cuts. FY25 fund totals are preliminary.
Annual Change in General Fund Appropriations by Spending Category: FY22 - FY25 (millions)
From FY22 to FY25, the General Fund's operating total grew by 9.84% from $8.11 billion to $8.91 billion. In FY25, the Department of Education comprised 50% of the General Fund budget, up from 45.9% in FY22. Health and human services made up the next largest share of the fund at 26.37%, up from 25.73% in FY22. The excessive budget reductions for administrative and regulatory agencies between FY22 and FY23 was due to a temporary funding of $100 million for the Chief Information Office; this office has since returned to zero dollars in appropriations.
Annual Change in All State Appropriations by Spending Category: FY22 - FY25 (millions)
The aggregate total of all state general fund and other appropriations was $9.3 billion in FY22 and $10.29 billion in FY25. Between FY22 and FY25, the Department of Education and Department of Health and Human Services received $730 and $431 million in additional funding, respectively. Together, they make up 119% of the total $977 million in additional appropriations during this period. This is due to other departments experiencing shrinking budgets, such as Public Health, Commerce, and the College Student Aid Commission, which had a combined reduction of $185 million in FY24 due to consolidation.
General Fund Appropriation to Each Spending Category: FY25 (millions)
The top two departments, Education and Human Services, were appropriated 76.4% of the total general fund budget in FY25. This is up from 70.7% in FY22, particularly due to recently passed ESA legislation, which has directly required more spending by the Department of Education. Sixteen of roughly 55 departments received less than 1% each of the total appropriation in FY25.
Total State Appropriations to Each Spending Category: FY25 (millions)
The top two departments, Education and Human Services, received 70.4% of all appropriations in FY25. This is up from 65.38% in FY22. These departments hold a smaller share of the total budget due to the Department of Transportation receiving 4.5%, or $462 million, from non-general fund funds in FY25. Eleven departments received less than 1% each of the total appropriation in FY25.
General Fund Appropriations by Spending Category: FY00 - FY25 (millions)
In the last 25 years, general fund appropriations grew by 88%. Health and human services grew by 155%, which was more than education, which grew by 118%. The next largest areas of government involved law; the justice system grew by 104% and corrections by 85%. In FY25, five areas received less funding than in FY00. The most significant reduction involved veteran affairs, which declined by 71%.
Total State Appropriations by Spending Category: FY00 - FY25 (millions)
Differences in the Share of Iowa's General Fund Appropriations
The values represent each category’s percent share of the increase in appropriations from FY00 to FY13 and from FY13 to FY25. A positive value indicates the share increased over this period and a negative value indicates a declining share.
Education and Healthcare constituted most of the additional general fund appropriations across both periods, making up a combined 109.51% of all newly appropriated funds between FY00 and FY13, and 83% between FY13 and FY25.
Differences in the Share of Iowa’s Total State Appropriations
The values represent each category’s percent share of the increase in appropriations from FY00 to FY13 and from FY13 to FY25. A positive value indicates the share increased over this period and a negative value indicates a declining share.
For all state appropriations, growth in healthcare outpaced growth in education in the first period while the opposite occurred in the second. Higher education experienced a notably higher percentage drop in the last 12 years relative to general fund appropriations alone, in part due to cutting the College Student Aid Commission and reducing capitals for the Board of Regents.
Beneficiary of Non-appropriated Federal Funds: FY08 - FY24 (millions)
The most significant benefactor of federal funding was health and human services, which received $6.05 billion, or 63.47% of all federal receipts, up 4% in share of receipts from FY23. Federal funding has especially prioritized health and human services due to the Medicaid expenditures, which is estimated to be $2.12 billion in FY25 according to legislative estimates. Education, transportation, regents, and workforce development only received $853.70, $652, $545.80, and $367.20 million from federal funds, respectively. LSA reports prior to FY08 do not break down funding per category and were therefore omitted.
Total State Spending per Iowan (2024 dollars)
Adjusted for inflation and population growth, total state government appropriations per Iowan increased by 31% from FY00 to FY13 and increased by 12.17% between FY13 and FY25. Over the last 25 years, the 47% total growth in state spending per Iowan from all sources was driven by non-appropriated federal funds, which alone grew by 122%. General funds per Iowan grew by 7.8% and appropriated non-general funds grew by 45%. Population estimates come from the Census Bureau and inflation is derived from the Midwest CPI published by BLS.