Introduction
Held from August 8-18, 2024, the Iowa State Fair welcomed 1,182,682 attendees this year, the most in its 170-year history. Thirty-first state by population in 2023, Iowa had the sixth largest state fair in the nation by total attendance and third largest by visitors per day. It has the second most attendees of any state fair relative to its population. The fair showcases Iowa agriculture, food, and entertainment. Spending tens of millions of dollars, families come to Des Moines to enjoy live entertainment, eat unique and delicious foods, enter fun contests, participate in arts and crafts, and more. This spending brings with it a surge in economic activity, which translates to jobs, personal income, and economic growth for the region. In this report, Common Sense analyses the economic activity at the state fair and uses a dynamic economic model to estimate the fair’s economic impact on Iowa.
Key Findings
- This year’s Iowa State Fair had the largest nominal economic impact of any in the fair’s 170-year history, contributing $172 million to the state’s GDP and $97 million in personal income.
- This year, fair attendance totaled 1,182,682 exceeding the previous record set in 2019. It also had 3 new daily attendance records.
- Common Sense Institute estimates fairgoers spent a total of $78.1 million dollars at the fair this year.
- The average family of three spent an estimated $126.46 per day at the Iowa State Fair this year.
- The 2024 Iowa State Fair had a larger economic impact than Taylor Swift’s concerts in Denver last summer, reported to total $140 million by CSI Colorado.[i]
- In 2020, the Association of Iowa Fairs reported that all 105 local and county fairs in Iowa generated $170 million in economic impact. This year, the Iowa State Fair alone generated $2 million more in economic impact than all those fairs combined.
America’s Classic State Fair
Starting with a budget of just $323 at its inception in 1854, the Iowa State Fair now attracts over a million of attendees every year from all over the United States. Fairgoers spend tens-of-millions of dollars annually into the state’s economy while enjoying 11 days of attractions and festivities. This last week, families were awed by the size of Finnegan the Boar, who set a fair record weighing 1,420 pounds in the Big Boar Competition. Teddy Bear, the winner of the Super Bull Contest, came in a whopping 3,064 pounds. Fairgoers also enjoyed viewing the traditional butter cow alongside butter-sculptures of Iowa natives Johnny Carson and Steve Higgins. Fairgoers looking for food had the option to purchase from one of nearly 200 food vendors this year.[ii] The fair sells 1.6 corndogs every second, with the coveted footlong corndog costing $10 this year. A corndog in hand, fairgoers could make their way to the grandstand concert for country star Brett Young or comedian Gabriel Iglesias, among other performers.[iii] All in all, the fair brings Iowans and out-of-state visitors together through unique and fun experiences, providing positive social impact, and as discussed in this report, meaningful economic impact.
When over a million visitors travel to Des Moines for the fair every year, an economic ripple effect reverberates through the state’s economy. Over the 11 days of the fair, consumer spending surges, generating revenue for businesses and government. Businesses owners then pay workers and reinvest into the economy, boosting personal incomes and creating economic growth. The increase in disposable income for businesses allows them to expand and improve their operations with the extra profits generated from the event. This often results in higher wages and more employment opportunities for many Iowans, which in turn directly fuels more growth, investments, and spending in the economy. While the full economic impact of a State Fair extends beyond fairground attendance and on-site spending, the ripple effect through the economy starts with these two factors.
Fair Attendance and Spending
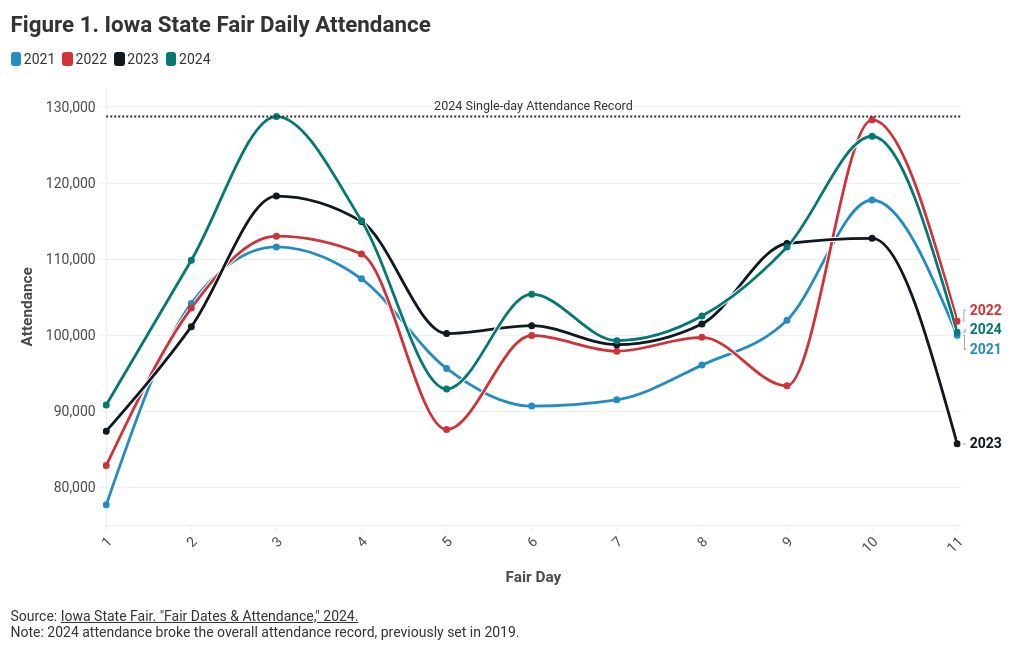
The Iowa State Fair is one of the largest and most visited fairs in the nation. Over the last decade, the state has maintained attendance levels between 1 and 1.2 million. In 2024, fairgoers set four attendance records. Saturday, August 10, set the all-time single-day attendance record at 128,732, beating the previous record of 128,298 set in 2022. With 115,048 attendees, Sunday, August 11, set the record for greatest first Sunday attendance, previously set in 2023. Tuesday, August 13, broke the Tuesday attendance record with 105,384, up from 102,953 in 2019. The 2024 fair also set an overall attendance record at 1,182,686, previously set at 1,170,375 in 2019. Figure 1 compares daily attendance at the Iowa State Fair over the past four years.
As foot traffic on the fairgrounds continues to increase each year, operating revenues also grow.[iv] Total operating revenue is the total value of the fair’s sales of goods and services, such as admission and concert tickets, parking, campground fees, as well as fees directly sourced from independent vendors. Independent food, beverage, and merchandise vendors are charged a fixed fee of their total gross sales to operate at the Fair. This fee is added to the fair’s operating revenue, while the remaining post-tax revenues are kept by vendors. Figure 2 compares attendance numbers with operating revenues in nominal dollars going back to 2015.
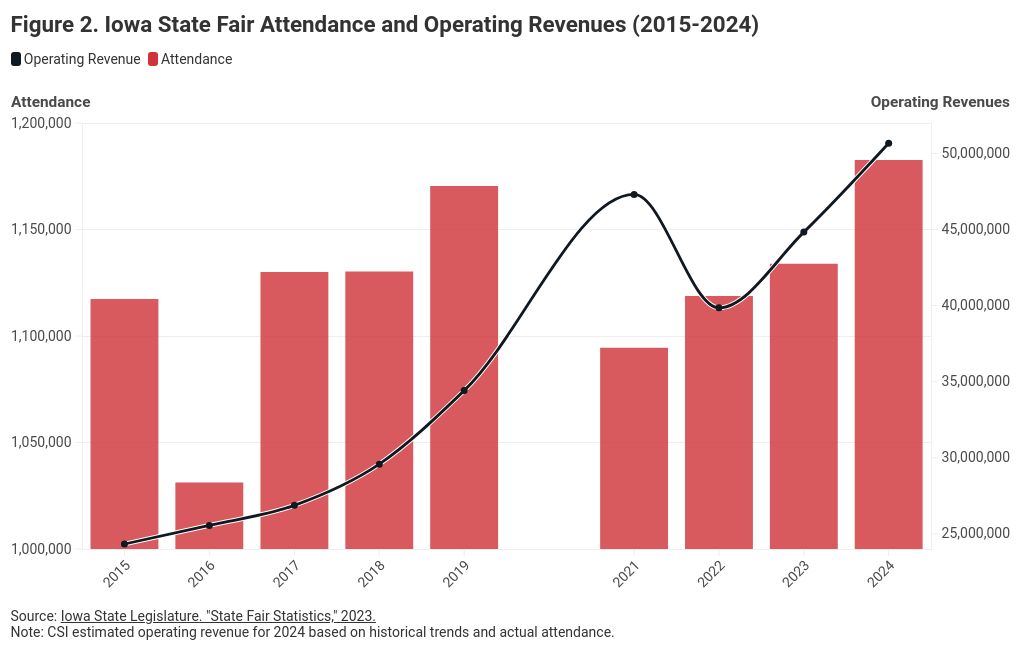
Operating revenues have almost doubled since 2015. While attendance has fluctuated within a range of about 140,000 attendees within this timeframe, revenues have trended up. Nominal revenue has grown by an average of 10% annually since 2015. Spending per attendee averaged just over $30 between 2015 and 2023, or about $36 in inflation-adjusted 2024 dollars. Higher personal incomes, inflation, a greater willingness to spend discretionary income at the fair, or other factors could explain the persistent increase in revenue despite fluctuating attendance. Regardless, fair spending continues to trend up. These attendance numbers and the money each fairgoer spends sets the basis for this report’s economic impact analysis.
Notably, 2021 fair revenue far exceeded every other year, disrupting the general trend in year-over-year revenue growth. Perhaps the cancellation of the fair in 2020 and the influx of discretionary income from COVID-19 related government stimulus provided a one-time boost to fairgoers’ appetite to spend. Meanwhile, fear of lingering strains of the COVID-19 virus likely suppressed attendance slightly. From 2019 to 2021, fair spending increased by about 38%. It then declined by 16% from 2021 to 2022 before continuing its upward trajectory.
Measuring State Fair Economic Activity
Common Sense Institute’s analysis of the 2024 Iowa State fair uses a variety of publicly available information on State Fair financials to determine an annual economic impact. These variables include food, merchandise, and alcohol sales, overall operating revenues, state and local taxes and fees, and tourism spending. These values serve as inputs into REMI (Regional Economics Models, Inc.) to produce an estimate of the Fair’s economic impact on Iowa. Given the constraints in data availability, the model simulation assumes all spending at the fair is new spending.
Employment was not directly inputted into the REMI model but is significant to mention given the magnitude of additional jobs added each year. Employment numbers were sourced directly from the Iowa State Fair website and supplementary financial audits done by the Iowa Department of Revenue. The fair employs roughly “1600 seasonal or fair-time members.”[v] Additional workers hired by concessionaries and exhibitors is estimated to be approximately 1000.[vi] Information on payroll, specifically for the 1,600 employees contracted with the State Fair authority, is available through auditor reports—the most recent being in 2022.[vii] Estimates for the remaining 1,000 employees were computed through a proportional increase, assuming each employee was paid the same wage. Wage values in table 1 represent the actual wage payroll and is measured in thousands of nominal dollars.
| Table 1. Iowa State Fair Employment and Wages |
| Model Input |
Industry |
2021 |
2022 |
2023 |
2024 |
|
| Employment |
Amusement, gambling, and recreation industries |
2,600 |
2,600 |
2,600 |
2,600 |
|
| Wages |
Amusement, gambling, and recreation industries |
$8,245 |
$9,064 |
$9,523 |
$10,483 |
|
| Source: Iowa State Fair and Iowa Auditor of State |
|
|
|
| Note: Employment in standard units and currency in thousands of current dollars. |
| *CSI Estimate |
|
|
|
|
|
|
State and local government taxes were input into REMI as new state and local government spending, respectively. These policy variables assume that all the taxes and fees that go directly to the state and state fair authority will be spent back into the economy. The data for these values were derived from total gross sales of food, merchandise, and alcohol, all of which was available through audited financial reports. According to the state fair’s website, food and drink vendors pay a 19.5% fee of all gross sales after sales tax to operate at the fair while merchandise vendors pay only 15%.[viii] These vendors also pay a fixed fee per square foot of space used, but this data is not readily available. Sales tax estimates were split between 6% for the state of Iowa, and an additional 1% county sales tax for Polk County.
| Table 2. Iowa State Fair Tax and Fee Revenue |
| Model Input |
Industry |
2021 |
2022 |
2023 |
2024 |
|
| Taxes and Fees |
State Government |
$6,164 |
$7,305 |
$7,675 |
$8,158 |
|
| Taxes |
Local Government |
$267 |
$314 |
$330 |
$351 |
|
| Source: Iowa Auditor of State |
|
|
|
|
|
| Note: Currency in thousands of current dollars |
|
|
|
| * CSI Estimate |
|
|
|
|
|
|
The remaining operating revenues and vendor sales were added to a “Detailed Industry Sales (Exogenous Production)” policy variable. Industry sales values in table 3 represent the total spending of attendees at the fair and is measured in thousands of nominal dollars. This value is the summed total of the fair’s operating revenues and private vendor sales and reflects the total production or output of vendors and fairground transactions.
| Table 3. Iowa State Fair Spending |
|
|
| Model Input |
Industry |
2021 |
2022 |
2023 |
2024 |
|
| Detailed Industry Sales |
Other amusement and recreation industries |
$73,998 |
$71,258 |
$77,823 |
$86,989 |
|
| Source: Iowa Auditor of State |
|
|
|
|
|
| Note: Currency in thousands of current dollars. |
|
|
|
| *CSI Estimate |
|
|
|
|
|
|
Tourism spending plays a significant role in economic impact. Every year, out-of-town visitors fly or drive to Des Moines and spend their discretionary budgets on hotels, restaurants, public transportation, merchandise, and more. This spending stimulates the broader Iowa economy by inducing higher levels of production, employment, and business growth. In 2022, tourists made up 48% of attendees and spent roughly $100 million during their stay in Iowa, according to data retrieved from the State Fair Authority. Assuming tourists spend 50% more at the fair than residents, CSI estimates that around 42% of total tourism spending occurs outside of the fairgrounds. Table 4 illustrates the policy variable for tourism spending, as well as the final spending estimates outside the fairgrounds between 2021 and 2024 that were input into the model.
| Table 4. Tourism Spending |
|
|
|
| Model Input |
Variable Type |
2021 |
2022 |
2023 |
2024 |
| Tourism Spending |
Nonresident |
$58,105* |
$63,089 |
$63,114* |
$63,223* |
| Source: State Fair Authority |
|
|
|
|
|
| Note: Currency in inflation-adjusted 2024 dollars. |
|
|
|
| *CSI estimate |
|
|
|
|
|
Economic Impact of the Iowa State Fair
Common Sense Institute estimates the Iowa State Fair contributed to $172 million in economic output and $97 in personal income growth in 2024. Table 4 shows the economic impact of the fair over the past four years since the fair was canceled in 2020 due to the pandemic. All presented data from these additional years will be in 2024 dollars to account for inflation since the pandemic. The fair has also supported job growth—in addition to the 2,600 fair-specific jobs—throughout the Iowa economy. Employment is reported as the direct and indirect jobs gained from the fair, which are spread across various industries such as entertainment, food and beverage, and construction, to name a few.
| Table 5. Economic Impact of the Iowa State Fair |
| |
2021 |
2022 |
2023 |
2024 |
| GPD Contribution |
$162 |
$154 |
$164 |
$172 |
| Personal Income Growth |
$91 |
$86 |
$92 |
$97 |
| Employment |
870 |
804 |
883 |
957 |
| Source: REMI |
|
|
|
|
| Note: Currency in millions of inflation-adjusted 2024 dollars. |
|
|
|
Before this year, 2019 had the highest attendance numbers in history and 2021 had the highest level of operating revenues, as seen in figure 2. Given that the fair experienced record attendance this year, the economic impact in 2024 exceeded that of both in real dollars, marking this year’s fair as having the largest economic impact of any fair in state history.
End Notes
[i] Cole Anderson and Andy Archuleta, “Swiftonomics: Eras Tour Impact on Colorado,” Common Sense Institute Colorado (July 2023). https://commonsenseinstituteco.org/swiftonomics/.
[ii] Iowa State Fair, “Food.” (2024). https://www.iowastatefair.org/food.
[iii] Iowa State Fair, “Trivia.” (2024). https://www.iowastatefair.org/about/trivia.
[iv] Office of Auditor of State Iowa, “Audit Reports.” https://www.auditor.iowa.gov/reports/audit-reports?keyword=iowa+state+fair&EntityTypeID=&CategoryID=&ReleaseDate=&ReleaseDateTo=&ReportPeriodEnding=&ReportPeriodEndingTo=&FirmID=.
[v] Iowa State Fair, “Employment.” (2024). https://www.iowastatefair.org/about/employment.
[vi] Iowa State Fair, “Trivia,” (2024). https://www.iowastatefair.org/about/trivia.
[vii] Office of Auditor of State Iowa, “Audit Reports.” https://www.auditor.iowa.gov/reports/audit-reports?keyword=Iowa+State+Fair+&EntityTypeID=&CategoryID=&ReleaseDate=&ReleaseDateTo=&ReportPeriodEnding=&ReportPeriodEndingTo=&FirmID=
[viii] Iowa State Fair, “Rental Space Guide.” (2024). https://www.iowastatefair.org/participate/commercial-space/space-rental-guide.