





October 6, 2026
Key Findings
- From 2010 to 2020, and even earlier, Oregon workers did quite well. Oregon workers saw the 5th fastest growth in average wages among states. This period of strong growth for Oregon workers came to an abrupt post-2020. Since 2020, Oregon workers have been falling behind. Average wage growth in the state is now 30th among states with no prospects of getting any better.
-
- What if Oregon workers had kept their 5th place spot? How much extra average quarterly pay would Oregon workers have? In 2025, Oregon workers were missing an estimated $858 per quarter, equivalent to $3,431 on an annualized basis.
-
- With an estimated annualized wage gap of $3,431 per worker in 2025, perhaps employment has done better? Unfortunately, that’s not the case. If one compares actual Oregon employment to its trend prior to 2020, Oregon is approximately 259,000 jobs below its pre-2020 trend
-
-
- The missing wages and jobs equate to about $27 billion in missing wages for workers in 2025.
- The reduced wages in 2025 result in an estimated $54 million less in annual personal income tax revenue to support state services.
-
-
- Looking cumulatively from 2021 through 2026, and the missing wages for Oregon’s workers is enormous, reaching $73 billion.
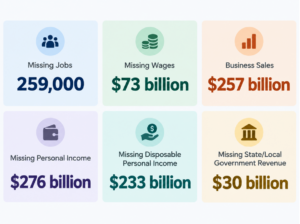
- The missing wages and jobs equate to broader economic impact. Over six years, missing wages of $73 billion and missing jobs of 259,000 equates to (shown below):
- Missing business sales of $257 billion, missing personal income of $276 billion, missing disposable personal income of $233 billion, and missing state/local government revenue of $30 billion (around 11% of state/local government revenue).
Introduction
Entering the COVID-19 pandemic, Oregon was a place to be for workers. From 2015 to 2019, employment in Oregon grew 9.3%, ranking 8th among the 50 states and Washington, D.C. As a state with strong jobs growth heading into the pandemic, one would think that Oregon would come out of the pandemic as a leader as well. That didn’t happen. Oregon has lost its place as one of the top places for jobs. It is now one of the more difficult places to find a job. Why?
Using data from the Quarterly Census of Employment and Wages (QCEW), this report examines how Oregon’s employment and wage base has changed from the beginning of the COVID-19 pandemic through the first quarter of 2026 and how that growth compares with the nation and other states.
The comparison is particularly useful because it puts Oregon’s employment picture in the context of where the state started before the pandemic. Rather than asking simply whether Oregon recovered the jobs lost during the pandemic, this analysis asks how many more jobs Oregon might have today if employment growth kept pace with its pre-pandemic leadership status. Overall, Oregon has lost its role as a leader for workers – when measured by jobs or wages.Looking at the Employment Trend
Oregon experienced sustained employment growth during the decade leading up to the COVID-19 pandemic. In the first quarter of 2010, employment stood at approximately 1.56 million. By the first quarter of 2020, it had increased to about 1.94 million.
The pandemic interrupted that trajectory. Employment fell to approximately 1.82 million in the first quarter of 2021 before recovering over the next two years. By the first quarter of 2023, employment had reached approximately 1.97 million. Since then, however, employment growth has largely flattened. Oregon recorded approximately 1.95 million jobs in the first quarter of 2026, roughly the same level as six years earlier.Figure 1
The difference between the two periods becomes clearer when employment growth is annualized. From the first quarter of 2010 to the first quarter of 2020, Oregon employment increased by 24.7%, equivalent to an annualized growth rate of 2.23%. From the first quarter of 2020 to the first quarter of 2026, employment increased by just 0.25%, equivalent to an annualized growth rate of 0.04%.
In other words, Oregon’s annualized employment growth rate declined by approximately 2.19 percentage points between the two periods.
Oregon’s recent weakness begs for answers to the question: Why?Figure 2
How Does Oregon Compare?
When looking at the share of jobs located in Oregon across the U.S., the share reached a high of almost 1.3% in 2019. Since then, the picture has deteriorated as other states took Oregon’s place as the place to be. Again, this begs an answer to the question: Why?
Figure 3
The state-level comparisons show a similar pattern. Idaho averaged 2.48% annual employment growth between 2010 and 2020 and 2.43% between 2020 and 2026. Utah’s annualized growth rate declined from 3.05% to 2.16%, while Texas declined from 2.35% to 1.82%.
Oregon experienced a much larger slowdown. Its annualized employment growth rate fell from 2.23% to 0.04%, a decline of 2.19 percentage points. Oregon’s decline was larger than that of most states and the District of Columbia, although the District of Columbia experienced a larger reduction. Again – why?What if Workers in Oregon Had Kept Up?
Oregonians’ Wages
Up to this point, we’ve seen Oregon’s lackluster job growth post-pandemic. Have wages kept up or does the picture for wages look similar to jobs? The following figure depicts the growth in average wages for all 50 states and D.C. In blue is Oregon. Notice in 2013 Oregon was about in line with the trend (the dotted line). Then, from 2013 through 2020, average wages grew much faster in Oregon than in other states. Oregon was a top place to be for workers. It surpasses all other states except Washington, California, North Dakota, and Massachusetts.
The 2010 to 2020 period was a strong decade for Oregon workers. Employment growth during the decade came close to the pace Oregon experienced during the 1990s, when the state’s technology sector took off. Since 2020, however, the picture has changed considerably.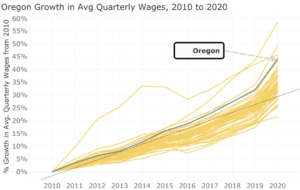
Figure 4
What follows is a comparison of the same average quarterly wages picture from 2020 through the first quarter of 2026. Notice anything? Oregon no longer leads the way for workers. The state now comes in ranked 30th for wage growth from 2020 through 2026. What happened? Why are Oregon workers not keeping up?
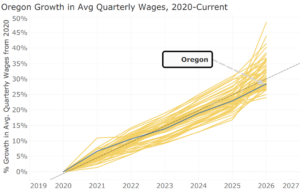
Figure 5
What the Drop from 5th to 30th Means in Wages?
What does the wage slump for Oregon workers mean? How much missing income is there? Based on the BLS’ Quarterly Census of Employment and Wages , average wages across all industries and all employer types grew from $10,415 to $14,989 from 2010 to 2020, a growth rate of 44% — placing Oregon workers fifth among states. From 2020 through the end of 2025, wages grew to $18,428, up 23% — placing Oregon workers 30th. What if Oregon workers had kept their 5th place spot? How much extra average quarterly pay would Oregon workers have? The answer is: In 2025, Oregon workers were missing an estimated $858 per quarter, equivalent to $3,431 on an annualized basis.
Table 1
Oregonians’ Jobs
Up to this point, it seems clear Oregon workers are not doing as well as they were pre-COVID pandemic. The previous section showed that had Oregon kept up the pace it had prior to the pandemic, Oregon workers would be $3,400 richer each year. This is the missing wages. What about missing jobs? How many missing jobs are there in the state? The following figure is the trend in Oregon jobs pre-2020 and post-2020. Does anything stand out? Unfortunately, jobs in the state are nowhere near where the pre-pandemic trend would suggest they should be. If we simply take the difference between Oregon’s employment trend pre-2020 with post-2020, the gap is enormous – Oregon is missing 259,000 jobs.
Figure 6
Missing Income for Workers
What do the missing income and jobs mean overall? If we simply multiply the missing jobs by average quarterly income, then Oregon is missing $19 billion in worker income, or about 11% of potential wages. In addition to the missing income at current wage rates, Oregonians are also missing wage growth after falling from the 5th best state for wage growth to 30th. Adding the missing average wages to the total ($3,431 per worker), and Oregon is missing an additional $26.7 billion in worker income (about 17% of all salaries and wages paid to Oregon workers ). In addition to less income for households, the lower wage growth translates into $54 million less income tax revenue available for state government services.
The one year snapshot, of course, only captures part of the picture. Cumulatively, there’s $73 billion in missing wages and salaries from 2021 through 2026.The Broader Economic Impact from Missing Worker Income
The missing jobs and wages equate with broader economic impacts. Because the missing jobs and wages are indicative of a weaker economy, Oregon is missing other commonly measured things – such as business sales, households, retail sales, and state/local government tax revenue. To model the broader economic impact, CSI employed REMI Tax PI+ version 7125 to correlate what the missing $73 billion Oregan’s workers’ wages means for the broader Oregon economy.
Using missing $73 billion in missing wages and 259,000 missing jobs from 2021 through 2026, the correlated broader economic impact is shown below.1 Overall, much slower growth Oregon has adopted equates to large missing cumulative economic impact (the figures below are for all six years).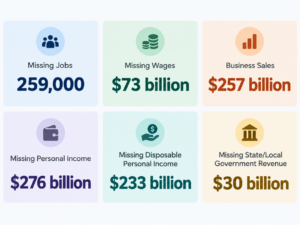
Figure 7
Bottom Line
In sum, Oregon has gone from a state with enormous opportunity for workers and businesses to a state barely growing – at least when compared to other states. Why Oregon has gone from a leader for workers to one workers are increasingly moving away from is a question left for future study. What isn’t in question is that Oregon’s workers have not done well over the past five years relative to other states.
Footnotes
- The model results reported in this section use $73 billion in missing total wages (i.e., the Total Wage Bill) spread across six years with the annual amounts consistent with the prior analysis in the report and matching direct employment differences between the trend and actual jobs. Given that REMI is a projection software rather than a model on historical experience, the results presented here answer the question: “What would the broader economic impact be if total direct, economywide wages were $73 billion less and jobs were 259,000 less – cumulatively – from 2025 through 2030”. As such, the results here are illustrative of the broader economic impact, although the historical figures differ somewhat.↩